
Is Apple A Buy, Hold Or Sell Right Now?
Apple (AAPL) is becoming one of the most shareholder-friendly companies around, when judged by the amount of money that they return to shareholders in the form of stock buybacks and dividends. For example, in March, 2012, Apple announced its initial capital return program of $45 billion, which it subsequently increased to $100 billion in April 2013, and further increased to $130 billion in April 2014.
Why did AAPL do this?
Because free cash flow growth has slowed considerably over the past few years when compared to the go-go growth period of 2009-2012, as the table below illustrates.
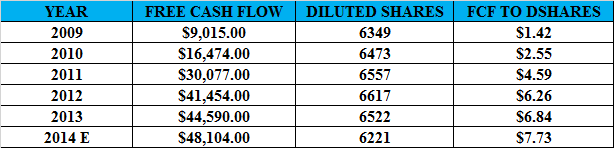
The company has bought back almost 400 million shares in the last two years (when you factor in the estimated diluted shares outstanding for 2014). Value Line predicts that Apple will eventually have just 5.6 billion shares outstanding by 2017-2019. That amounts to another 600 million shares bought back in the next 3-5 years.
Had the company not bought back those 400 million diluted shares, its free cash flow per diluted share would have been just $7.26 instead of the 2014-estimated $7.73. This is just one example of why the markets continue to go up, as practically 80% of the companies that make up the S&P 500 Index are also buying back shares. Growth has been universally slow, but corporate borrowing to buy back shares has been unprecedented. Zero Hedge reported that companies such as Boeing (BA), Caterpillar (CAT), Cisco Systems (CSCO), 3M (MMM), Microsoft (MSFT) and Travelers (TRV) have bought back more than 10% of their shares.
Finally it’s now time to bring valuation into the equation. One of the best ways to evaluate how overbought or oversold a company is on the stock market is to measure its free cash flow yield. I try to get at least 5 years of historical free cash flow yield data in chart form, in order to visualize the trend. The following is a chart published by Heartland Funds which exemplifies the benefits of buying when free cash flow yields are high and selling when they are low.
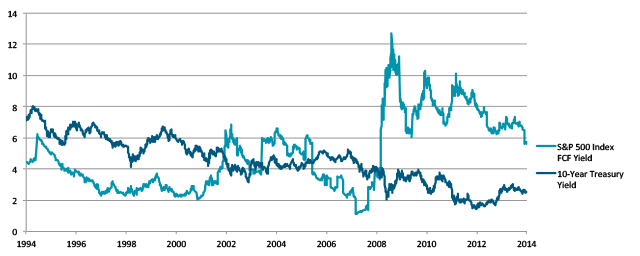
Free Cash Flow Yield = Free Cash Flow Per Share/Market Price Per Share
The chart clearly shows that selling in 2007 and buying back in 2009 would have been the smart move to make for it has been my experience that when any financial instrument breaks below a 2% yield, investors tend to look elsewhere for opportunities. Conversely, when yields break above 10%, it is usually a safe time to buy.
The following chart is an example of this strategy, using Apple’s free cash flow yield for the period 2009-2014.
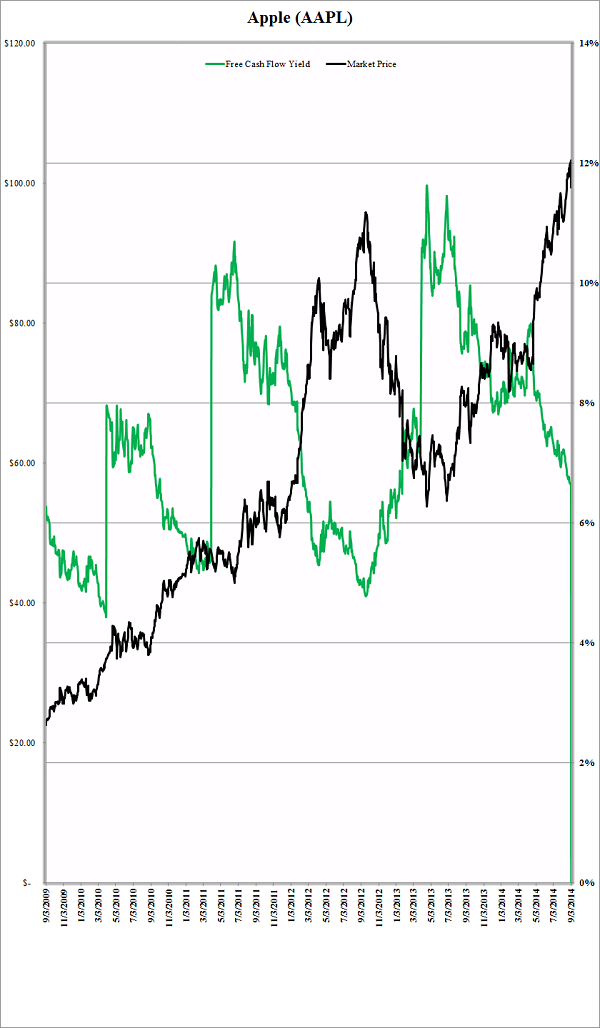
On September 3, 2014 Apple finished the day with a 6.9% free cash flow yield, but since we will not get the official final results for 2014 until Apple closes its books in late October, we are thus forced to use its 2013 free cash flow figures in calculating its yield. But on the other hand if we were to use the estimated free cash flow of $7.73 per share and use Apple’s September 3, 2014 market closing price of $98.94, we get a real time free cash flow yield estimate of $7.73/$98.94 = 7.81%.
That 7.81% yield is still quite attractive and Apple’s stock is far from overvalued. Within the next week Apple should be able to give us a better idea on how its business is doing when it has its special media conference, where it plans to announce its new line of upgraded products. With the S&P 500 Index having a free cash flow yield of about 5.6% currently, Apple, despite its recent run up, is still quite attractive.
None.


Any updates on this? There's been a lot of Apple news since this was written!