
Australian Dollar Eyes Chinese Economic Data, Will AUD/USD React?
Monday’s Asia-pacific Forecast
The Australian Dollar is in focus to kick off the week, with several economic data prints due out of China. Markets are coming off a mixed week, the safe-haven US Dollar gained against most of its peers, while US equity markets fell as Treasury yields increased. The risk-sensitive AUD/USD pair fell nearly 1% last week, with the bulk of weakness coming after a hot inflation (CPI) print out of the United States.

Photo by Ezreal Zhang on Unsplash
Rising prices across the global economy is a centerpiece issue that has investors attempting to gauge the impacts on economic activity and central bank policy over the coming months. Japan will report inflation data for October later this week. This morning, the island nation’s third-quarter gross domestic product data crossed the wires. Output dropped to -3.0% q/q, missing the consensus forecast calling for -0.7%.
New Zealand’s performance of services index (BNZ) crossed the wires this morning at 44.6 for October. That is a decrease from the downwardly revised September figure of 46.5. The 1.9 point drop is discouraging, but the approaching holiday season may provide a tailwind for the index in the coming months.
The incoming Chinese economic data – due out over the next couple of hours – is likely to dictate market sentiment, with fixed-asset investment, industrial production, retail sales, and unemployment set to cross the wires. Retail sales and industrial production data may command the most attention, with analysts’ expectations at 3.7% y/y and 3.0% y/y, respectively. Those forecasts are lower from the prior month’s reading. A poor showing may weigh on the Australian Dollar.
AUD/USD Technical Forecast
AUD/USD may rise after a Bullish Engulfing candlestick pattern formed late last week on the daily chart. The high-profile signal– which occurs at the bottom of a downtrend – suggests a reversal to the upside may be on the cards. If prices do rise, the 50-day Simple Moving Average (SMA) is a likely point of resistance.
AUD/USD Daily Chart
(Click on image to enlarge)
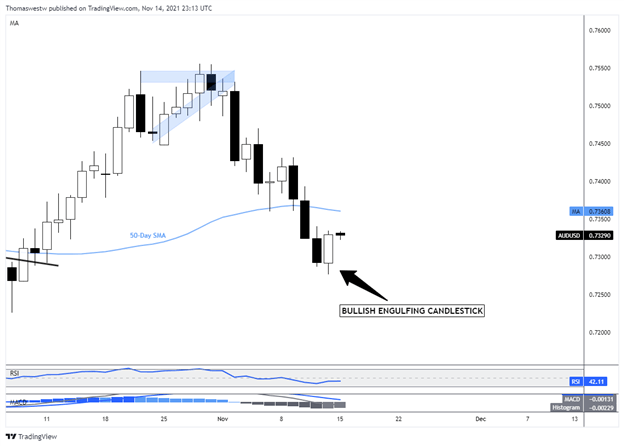
Chart created with TradingView
Disclaimer: Riki nema disclaimer.


