
Current & Historical US Treasury Rates And Yields
Today the ten year US Treasury note closed above a 6-year resistance line. The next level of resistance is the dashed black line on chart 1 that is currently at about 3.75%. Chart 2 below shows this 28-year trend of the 10-year Treasury bond yield dashed black resistance line has been in effect for 28-years.
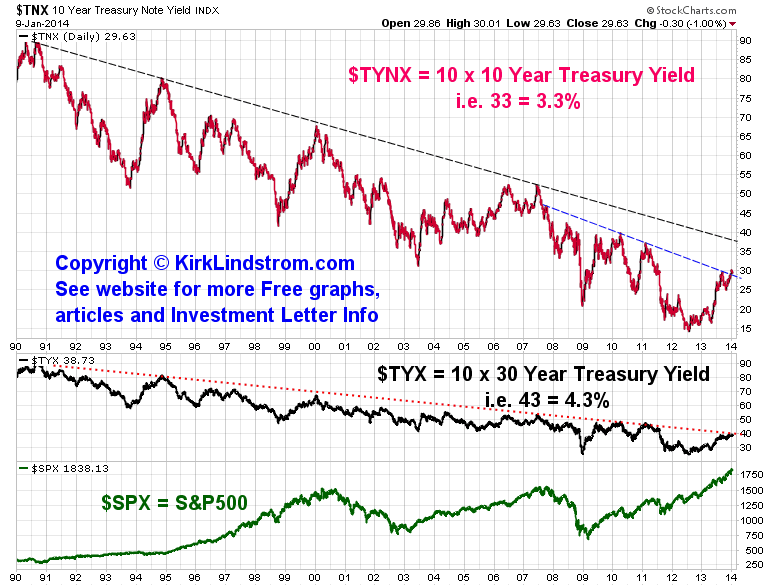
Chart 2: Commentary from Chart of the Day:
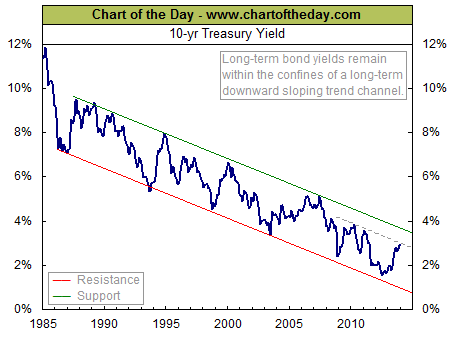
For some perspective on all-important long-term interest rates, today's chart illustrates the 28-year trend of the 10-year Treasury bond yield (thick blue line). As today's chart illustrates, the 10-year Treasury bond yield has moved within the confines of a 27-year downward sloping trend channel. More recently, a modest but improved economic outlook in the US has helped send the 10-year Treasury bond yield higher over the past 18 months. In fact, the 10-year yield has increased a very significant 140 basis points (i.e. 1.4%) since its resistance testing, July 2012 trough. In the end, this upward move in long-term yields is something to watch in light of the US economy's ever increasing dependence on debt.
The information contained in this web site is not intended to constitute financial advice, and is not a recommendation or solicitation to buy, sell or hold any security. This blog is strictly ...
more

