
The Coming Week’s Top Market Movers, Lessons: The Drivers, Questions That Actually Matter
After last week’s dramas, here are the lessons and likely market movers to keep in mind for most global markets
Summary
–Technical Outlook: Short Term Neutral US And Asia, Neutral/Bullish For Europe, Medium Term Bullish All 3 Regions
–Fundamental Outlook 1: Lessons from the latest on the state of the global stock rally, the ECB’s new stimulus moves, US jobs reports, and more
–Fundamental Outlook 2: Likely market movers for this week and beyond, and how weak EU PMIs moved multiple markets
– Biggest Questions & What To Watch To Answer Them
TECHNICAL PICTURE
We look at the technical picture first for a number of reasons, including:
Chart Don’t Lie: Dramatic headlines and dominant news themes don’t necessarily move markets. Price action is critical for understanding what events and developments are and are not actually driving markets. There’s nothing like flat or trendless price action to tell you to discount seemingly dramatic headlines – or to get you thinking about why a given risk is not being priced in
Charts Also Move Markets: Support, resistance, and momentum indicators also move markets, especially in the absence of surprises from top tier news and economic reports. For example, the stronger a given support or resistance level, the more likely a trend is to pause at that point. Similarly, a confirmed break above key resistance makes traders much more receptive to positive news that provides an excuse to trade in that direction.
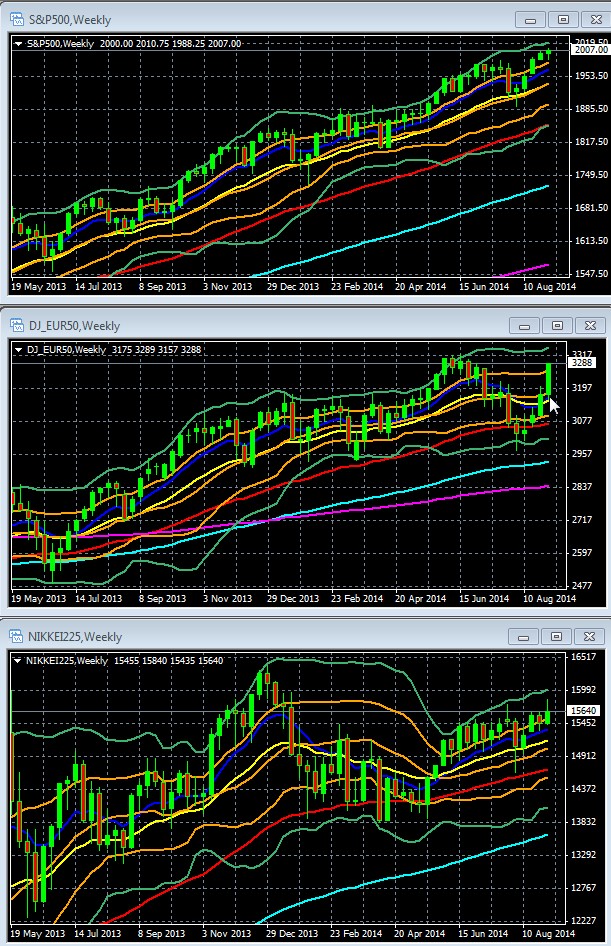
Overall Risk Appetite Medium Term Per Weekly Charts Of Leading Global Stock Indexes

Weekly Charts Of Large Cap Global Indexes May 19 2013 To August 5 2014: With 10 Week/200 Day EMA In Red: LEFT COLUMN TOP TO BOTTOM: S&P 500, DJ 30, FTSE 100, MIDDLE: CAC 40, DJ EUR 50, DAX 30, RIGHT: HANG SENG, MSCI TAIWAN, NIKKEI 225
Key For S&P 500, DJ EUR 50, Nikkei 225 Weekly Chart: 10 Week EMA Dark Blue, 20 WEEK EMA Yellow, 50 WEEK EMA Red, 100 WEEK EMA Light Blue, 200 WEEK EMA Violet, DOUBLE BOLLINGER BANDS: Normal 2 Standard Deviations Green, 1 Standard Deviation Orange.
Source: MetaQuotes Software Corp, www.fxempire.com, www.thesensibleguidetoforex.com
03 Sep. 07 13.18
Key Points And Lessons Weekly Charts: Medium Term Bullish
Given that this week’s economic calendar is very light on US and EU events, technical factors like support/resistance levels and momentum have a higher chance of influencing price movement in the major global indexes
European Indexes Close Performance Gap On New ECB Stimulus News
Powered by the surprise announcement of new stimulus coming from the ECB, European indexes have re-joined their US and European counterparts in the double Bollinger® band buy zone, as shown in a sample of the charts below. That suggests the odds favor more upside.
Key For S&P 500, DJ EUR 50, Nikkei 225 Daily Chart: 10 day EMA Dark Blue, 20 day EMA Yellow, 50 day EMA Red, 100 day EMA Light Blue, 200 day EMA Violet, DOUBLE BOLLINGER BANDS: Normal 2 Standard Deviations Green, 1 Standard Deviation Orange.
Source: MetaQuotes Software Corp, www.fxempire.com, www.thesensibleguidetoforex.com
07 Sep. 07 18.02
Sure, the EU’s economy reeks like an open sewer, and is burdened with a dysfunctional currency zone that it has proven incapable of reforming (see details on its failed banking union deal here and here for just one example). Yes, the whole Ukraine related sanctions thing could eventually produce another meaningful drag on an already weak economy. So what? The big lesson of recent years is that unless there is an imminent threat to the global economy, you don’t need an especially healthy economy for stocks to rise. The combination of abundant cash and suppressed rates forces investors into equities. It won’t last forever, but what does.
In sum, with most leading indexes continuing to show upward momentum, the odds favor more upside in the medium term. As for near term support and resistance, note that the economic calendar is light this week, and so investors should not expect their relevant index and market to move far beyond the highs and lows of prior weeks.
For example, looking at the daily S&P chart below, we’d be surprised to see the S&P 500 close the week above 2020 or below 1990. Readers who are focused on Europe or Asia should apply similar reasoning to forecast the likely trading range in these regions this week.
Key Points And Lessons Daily Charts: Short Term Neutral US And Asia, Neutral/Bullish For Europe

Key For S&P 500, DJ EUR 50, Nikkei 225 Daily Chart: 10 day EMA Dark Blue, 20 day EMA Yellow, 50 day EMA Red, 100 day EMA Light Blue, 200 day EMA Violet, DOUBLE BOLLINGER BANDS: Normal 2 Standard Deviations Green, 1 Standard Deviation Orange.
Source: MetaQuotes Software Corp, www.fxempire.com, www.thesensibleguidetoforex.com
03 Sep. 08 09.38
Key Points And Lessons – Daily Charts
US – Neutral Near Term Outlook: US markets are at the border of their double Bollinger® band buy zone and neutral zone, and have been in a very tight trading range in recent weeks despite the big events in the past week from the ECB and US jobs reports. Thus near term bias is neutral. The same forecast applies to the Nikkei and other Asian indexes for which it words as a decent proxy.
Europe – Bullish/Neutral Near Term Outlook: As shown above, the DJ Eurostoxx50, an adequate proxy for major European indexes, is firmly in its double Bollinger® band buy zone, giving it enough near term upward momentum to put the odds in favor of continued upside in the week ahead. Sentiment about the size of the as yet unannounced ABS program (the last big unknown about the new ECB stimulus moves), and thus anything that influences it, should be the key driver for European stocks in the near future.
Fundamental Picture
Here’s a rundown of lessons and most likely market moving events to keep in mind for this week and beyond.
Latest In The Bull Vs. Bear Debate
As has been widely noted, the continued resilience of global stocks has taken a toll on the number of bearish analyses coming out these days. Of what does come out, they typically point to factors that have been around for much of the rally and thus haven’t been decisive (economic performance doesn’t justify all-time highs, assorted tail risks, etc.
On the bullish side, the most compelling thing I read last week was a summary of a Morgan Stanley outlook. Highlights include.
Very low interest payments on debt burdens, and household debt dynamics suggest a sizable cushion protecting consumers in a rising interest rate environment.
In particular, many businesses have aggressively refinanced at lower rates and pushed out debt maturity dates, giving them added cash cushions for the years ahead.

04 Sep. 08 10.42
Inventories and capital spending do not appear over-extended.
Corporate management hubris and other corporate metrics of overheating remain muted.
Several broad economic indicators in the U.S. have only just reached “normal” expansionary levels and are far from looking unsustainable.
The report makes the usual, justified nods to tail risks of trouble from slowing in Europe, China, and Japan, as well as these regions’ own debt burdens.
See here for further details.
ECB Meeting: When Top Tier Events Surprise In Direction Of Established Trends
The ECB was expected to ease eventually, maybe even talk in general terms about coming measures. It was not generally expected to actually announce a rate cut as well as new plans for additional easing.
The results were what one might expect when we get that rare combination of a high-potential market moving event actually providing a major surprise, AND that surprise feeds a multi-month ongoing trend.
As I discuss in my book, except for very short term trading and day trading, fundamentals usually drive trends. However there are certain situations in which the technical picture actually influences how markets react to fundamental data.
One of the ways in which technical analysis (study of price action) overlaps with fundamental analysis (study of supply and demand factors) is when there is an established trend, because it gives investors a bias to heed news that confirms the trend and to ignore or react less to news that contradicts the trend.
There were many important lessons and ramifications from the ECB’s rate cut and new stimulus measures. The big surprise was in the timing. Most investors expected more stimulus steps, but not yet, as the TLTRO program hasn’t had time to make its influence felt.
Partial List Of Lessons From The ECB Meeting
By cutting interest rates and also preannouncing ABS purchases earlier than expected, we conclude:
- It’s grown so worried about the outlook for inflation and growth that they believe they can’t afford to wait until the new 4 year loans are rolled out later this month. As we’ve noted in recent weeks, at Jackson Hole Draghi admitted that he no longer saw deflation as a temporary problem. What’s changed since then? Continued bad EU economic data, and growing risk from economic sanctions stemming from Russian aggression against Ukraine.
- Thus even though the full effects of the TLTRO won’t be felt until November or December, clearly the ECB no longer thinks that the TLTRO will be enough to revive the deteriorating EU economy. Remember that the central bank has been criticized for months in much of the European financial press for doing too little too late in the past and once again being too slow to react to the mounting evidence of the EU’s economic stalling. The ECB no doubt sees the better US economic performance and is coming around to the Fed’s preference for erring on the side of more stimulus rather than less, especially with deflation concerns replacing inflation concerns, even for the inflation-phobic Germans.
There were many more lessons and ramifications, most of them relevant to virtually all investors regardless of their focus.
See our Weekly EURUSD Outlook for details, as well as for background information and a summary of the new steps.
US Jobs Report Miss
As we predicted last week, the combined impact of the NFP and unemployment reports were minimal, at most, it provided an excuse for a modest counter move higher that still leaves the pair sharply lower on the week. Why did these reports fail to move the pair up much, despite the theoretical weakening of the USD because weaker employment reports should delay USD-supportive Fed tightening? The short answer is, that the jobs report changes nothing in the Fed’s policy and thus in perceptions of the value of the USD.
- First, while the headline NFP figure missed (142,000 new jobs in August, versus an expected 230,000), there was some good news too.
- –The unemployment rate dropped to 6.1% from 6.2%, per the latest release from the BLS, and was in-line with expectations.
- –Wage growth was also in-line with expectations, with wages growing 2.1% year-over-year, and 0.2% month-over-month.
- –The average number of weekly hours worked held steady at 34.5 hours.
- -The July jobs report was also revised modestly higher, to 212,000 from 209,000
- –The “U-6″ unemployment rate, which includes those marginally in the labor force or those employed part time for economic reasons, fell to 12% from 12.2% in July.
- Second, Fed Chairperson Yellen has long made clear that Fed policy moves with longer term data trends, not the somewhat erratic single monthly data points. The Fed is already skeptical about the health of the US job market even with the recent string of overall good data, so this month’s NFP miss merely confirms that view.
With US data continuing to show improvement, only a smashing beat of forecasts could have aroused speculation that the Fed might view US unemployment as improved enough to warrant faster, greater tightening.
In sum, the reports didn’t pack enough of a negative surprise to change sentiment about the pace of Fed tightening. Meanwhile, the ECB is indeed accelerating its easing, so the USD continues to look better relative to the EUR.
See below for lessons on this.
Lessons From The US Jobs Reports
Friday’s very modest EURUSD bounce, plus the gains logged in most leading global indexes, both reflect a consensus that the reports didn’t change anyone’s perceptions about US growth.
- The NFP miss was just one month’s data and NFP data can be “noisy” with outlier monthly data not uncommon. Most of Wall Street does not believe the report influenced the Fed’s likely timing of its first rate hike in Q2 2015.
- There were some positives: the unemployment rate fell to 6.1% from 6.2%, wage growth was in-line with expectations, growing 2.1% year-over-year and 0.2% month-over-month.
- There is no significant data showing slowing labor demand. For example, the jobs component of last week’s ISM services PMI survey is rising and approaching multi-decade highs.

Source: August 2014 Non-Manufacturing ISM® Report On Business®
05 Sep. 07 17.33

Via Scott Grannis here
04 Sep. 07 17.27
Market Mover & Lesson: Weak EU PMIs Drive EUR Down, USD Up, Thus USDJPY and Japan Stocks Up
Here’s a classic illustration of the importance of inter-market analysis. The EURUSD fell due to yet another batch of poor EU PMI reports, thus strengthening the USD. That boost in USD demand often boosts the USD versus its other key counterparts, like the JPY. Sure enough the USDJPY spiked, That weakness in the JPY boosted Japanese stocks for their biggest weekly gain, as a cheaper Yen helps the all-important Japanese export sector. True, a planned cabinet reshuffle by PM Abe was also seen as supportive of higher stock prices, as it was seen as giving a boost to further pro-spending and growth reforms within the overall Abenomics program.
Lesson: Why US Stocks And USD Can Rise Together
Stocks are risk assets the rise with market optimism and fall with pessimism. The USD is still regarded as more of a safe haven currency, meaning it tends to rise in times of fear.
Thus the two usually move in opposite directions.
However, when the good news that boosts stocks also raises the chances of tighter fed policy (which in theory reduces or will reduce the supply of US dollars vs. demand and also raise US rates, which further feeds USD demand), then both stocks and the dollar can and do tend to rise together.
Ukraine Continues To Show Only Short Term Influence
News of escalations and de-escalations continue to have influence. As Russia appears intent on escalating, the bearish escalation pressure is more long lasting because that is the long term Russian policy for now. However signs of calming have tended to produce rallies until those signs are shown false.
Top Calendar Events To Watch
Again, it’s a relatively light calendar, but here are the things most likely to move most global asset markets (we omit events with only regional or national impact).
Monday
China: Trade balance
Tuesday: Nothing
Wednesday: Nothing
Thursday
China: CPI, PPI y/y
US: Weekly new unemployment claims. Relevant only to the extent that it influences the 4 week moving average and longer term trends for this metric, because the Fed is looking at these longer term trends rather than weekly or monthly data.
Friday
EU: Ecofin meetings
US: Retail sales m/m, preliminary UoM consumer sentiment, business inventories (remember, much of the recent GDP beat was attributed to inventory buildup, so we want to see if inventories are getting sold or setting up to become a drag on the next GDP reading as payback.
Saturday: China industrial production y/y, fixed asset investment ytd/y
Biggest Questions & What To Watch To Answer Them
- What will be the size and scope of the ECB’s coming ABS purchases, and how much of the coming details will already be priced in before the ECB reveals the details?
- Will we get any major surprises from the top market moving events of the above calendar?
- Will the coming round of economic sanctions between Russia and the West start to actually impact the global economy?
- Will US retail sales and UoM consumer sentiment continue to the upbeat trend in US data?
- Is there any real chance the October 17th FOMC meeting will reveal anything new?
The above is for informational purposes only, responsibility for all trading or investing decisions lies solely with the reader.


