
Sirona Reports Fiscal 2014 Fourth Quarter And Record Full Year Results
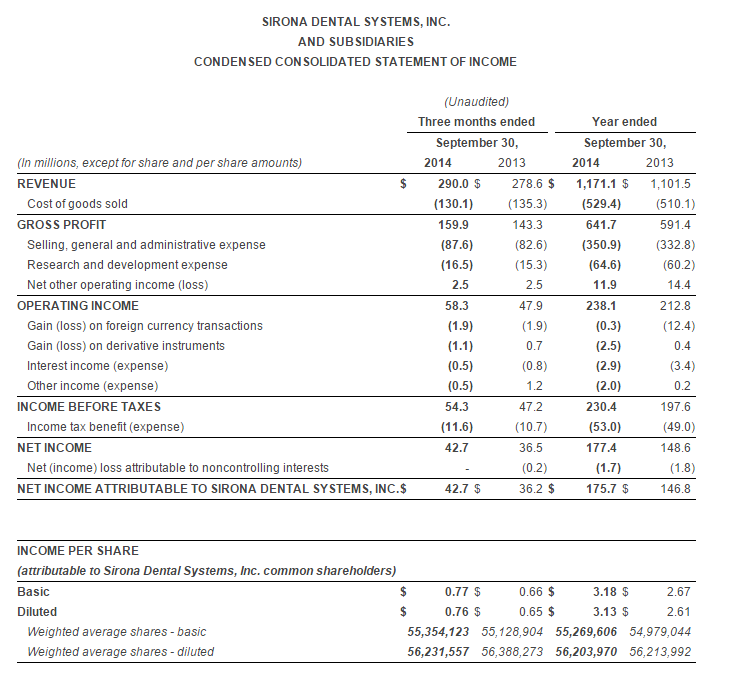
- Fourth quarter revenues of $290.0 million, up 4.1% compared to prior year, or up 4.0% constant currency*. Fiscal 2014 increased 6.3%, or 3.9% constant currency*.
- Fourth quarter diluted earnings per share of $0.76 on a GAAP reported basis compared to $0.65 in the prior year. Fourth quarter non-GAAP adjusted EPS* of $0.93, up 14.3% compared to $0.81 in the prior year. Fiscal 2014 EPS of $3.13 on a GAAP reported basis compared to $2.61 in the prior year. Fiscal 2014 non-GAAP adjusted EPS* of $3.67, up 7.8% compared to $3.41 in the prior year.
- Sirona announces Fiscal 2015 guidance: Revenue growth of 6% to 8% in local currencies, and non-GAAP adjusted EPS* in the range of $3.95 to $4.05 (reflecting growth of approximately 8% to 10%).
November 21, 2014 06:30 AM Eastern Standard Time
LONG ISLAND CITY, N.Y.--(BUSINESS WIRE)--Sirona (Nasdaq: SIRO), the dental technology leader, today announced its financial results for the quarter ended September 30, 2014.
“Reconciliation of GAAP and non-GAAP Information (unaudited)”
Fourth Quarter Fiscal 2014 vs. Fourth Quarter Fiscal 2013 Financial Results
Revenue was $290.0 million, an increase of $11.4 million or 4.1% (up 4.0% on a constant currency basis). The Company's business segments performed as follows: Treatment Centers increased 28.2% (up 28.0% on a constant currency basis), Instruments increased 12.8% (up 12.6% on a constant currency basis), Imaging Systems decreased 0.2% (down 0.3% on a constant currency basis), and CAD/CAM Systems decreased 5.0% (down 5.1% on a constant currency basis).
Revenue in the United States decreased 8.3%, and revenues outside the United States increased 8.9% (up 8.8% constant currency). As expected, U.S. revenues were impacted by late orders in the third quarter. New user demand for both Imaging and CAD/CAM remains robust, but could not compensate for a large trade-up program in the fourth quarter of last year. Sales growth in international markets was particularly strong in Germany and Asia Pacific.
Gross profit was $159.9 million, up $16.6 million. Gross profit margin was 55.1% in the fourth quarter of Fiscal 2014, compared to 51.4% in the prior year. The change in gross profit margin as a percent of sales was mainly driven by an improved product and regional sales mix combined with cost reductions.
Net income attributable to Sirona Dental Systems, Inc. for the fourth quarter of 2014 was $ 42.7 million, or $0.76 per diluted share, versus $36.2 million, or $0.65 per diluted share in the prior year period. Non-GAAP adjusted earnings per diluted share for the fourth quarter of 2014 was $0.93 compared to $0.81 in the prior year quarter, or an increase of 14.3%. A reconciliation of the non-GAAP measure to earnings per share calculated on a GAAP basis is provided in the attached table.
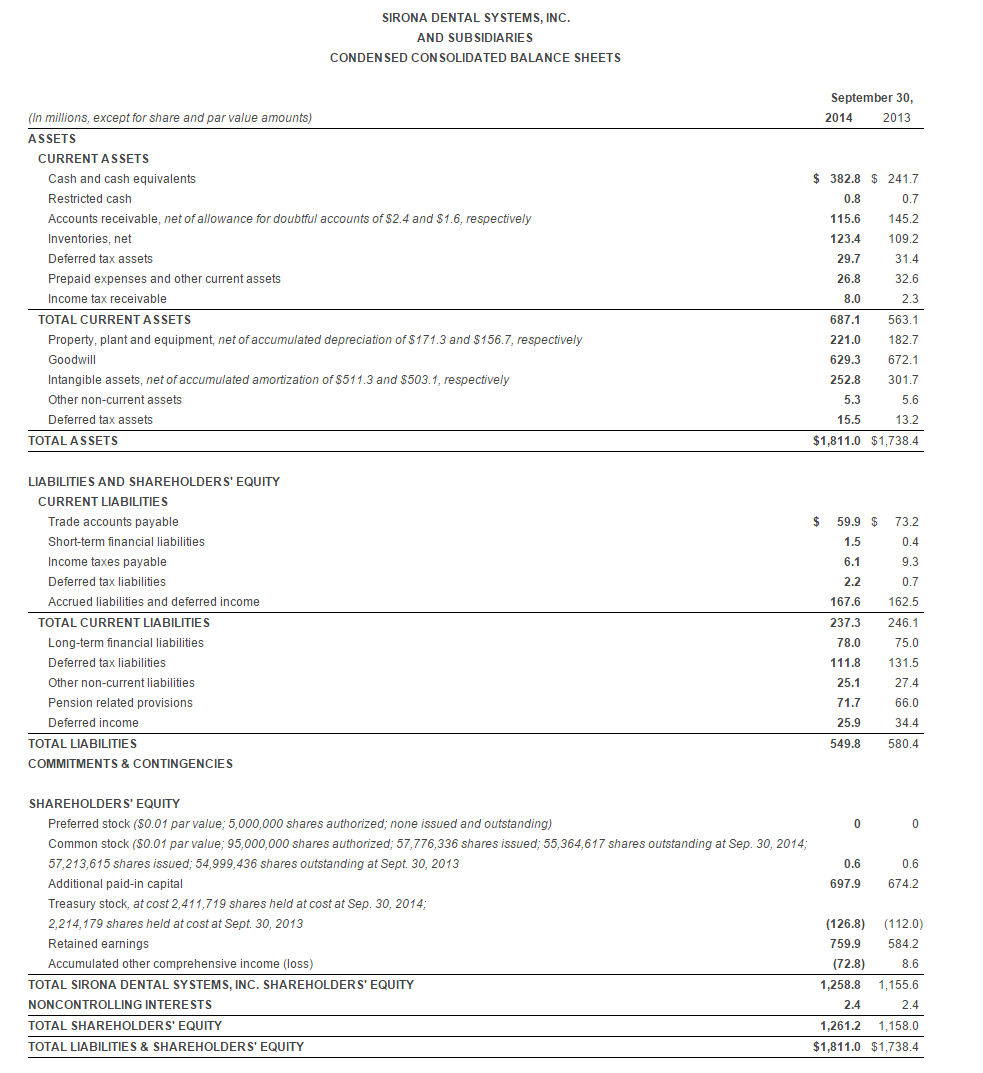
At September 30, 2014, the Company had cash and cash equivalents of $382.8 million and total debt of $79.5 million, resulting in net cash of $303.3 million. This compares to net cash of $217.5 at June 30, 2014 and $166.3 million at September 30, 2013.
Jeffrey Slovin, President and CEO of Sirona commented: “We closed out the year with a solid fourth quarter, driven by strength in international markets, particularly in Germany and Asia Pacific. Our margin expansion enabled strong double digit earnings growth on 4% revenue growth.”
Mr. Slovin continued: “Fiscal 2014 was another successful year for Sirona filled with many accomplishments. We drove leverage to the bottom line, strengthened our financial position and global distribution network and invested in our future. Innovation continues to drive demand as we grew our top line 6.4% in local currencies on the heels of 13.8% the year before. Sirona launched many successful new products and has been instrumental in the continued adoption of digital technologies. Our CEREC user community crossed a significant milestone, with now over 41,000 systems sold globally. Our strong brand, world class sales and service infrastructure and full product pipeline best position Sirona to lead dentistry in the digital era.”
Fiscal 2014 vs. Fiscal 2013 Financial Results
Revenue was $1,171.1 million, an increase of $69.6 million or 6.3% (up 3.9% on a constant currency basis). The Company's business segments performed as follows: Instruments increased 16.1% (up 12.3% on a constant currency basis), Treatment Centers increased 6.9% (up 3.4% on a constant currency basis), Imaging Systems increased 5.8% (up 4.0% on a constant currency basis), and CAD/CAM Systems increased 4.0% (up 1.9% on a constant currency basis).
Revenue in the United States increased 4.7%, and revenues outside the United States increased 7.1% (up 3.6% constant currency). U.S. revenues continued to benefit from strong, new-user demand for both our CAD/CAM and Imaging products, but faced a difficult overall year-over-year comparison, with prior-year growth of 18.2% benefiting from trade-up programs. Germany, our second-largest individual market, was down 2.5% constant currency over a challenging year-over-year comparison with prior-year growth of 23.4% constant currency. Strong local sales growth in other international markets (led by Japan, China, and Brazil) was largely offset by the weakening of major currencies in these markets.
Gross profit was $641.7 million, up $50.3 million. Gross profit margin was 54.8% in Fiscal 2014, compared to 53.7% in the prior year. The increase in the gross profit margin was mainly due to improvements in product, regional, and channel mix combined with cost reductions, more than offsetting headwinds from foreign exchange effects that cut across all segments.
Net income attributable to Sirona Dental Systems, Inc. for Fiscal 2014 was $175.7 million or $3.13 per diluted share, versus $146.8 million, or $2.61 per diluted share in the prior year. Non-GAAP adjusted earnings per diluted share for Fiscal 2014 was $3.67 compared to $3.41 in the prior year, or an increase of 7.8%. A reconciliation of the non-GAAP measure to earnings per share calculated on a GAAP basis is provided in the attached table.
Fiscal 2015 Guidance
Management anticipates Fiscal 2015 revenue growth of 6% to 8% in local currencies and non-GAAP adjusted EPS* in the range of $3.95 to $4.05 (reflecting growth of approximately 8% to 10%).
Mr. Slovin concluded: “In Fiscal 2015, we expect to continue our above market revenue growth and leverage our infrastructure to drive even greater bottom line growth. We will again introduce many new innovations at this year’s International Dental Show in March. We expect these products to garner considerable demand and start driving significant growth in the back half of the year.”
Conference Call/Webcast Information
Sirona will hold a conference call to discuss its financial results at 8:30 a.m. Eastern Time on November 21, 2014. The teleconference can be accessed by calling ![]() +1-877-703-6108 (domestic) or
+1-877-703-6108 (domestic) or ![]() +1-857-244-7307 (international) using passcode # 43925518. The webcast will be available via the Internet at http://ir.sirona.com, and a presentation relating to the call will be available on our website. A replay of the conference call will be available through November 29, 2014 by calling
+1-857-244-7307 (international) using passcode # 43925518. The webcast will be available via the Internet at http://ir.sirona.com, and a presentation relating to the call will be available on our website. A replay of the conference call will be available through November 29, 2014 by calling ![]() +1-888-286-8010 (domestic) or
+1-888-286-8010 (domestic) or ![]() +1-617-801-6888 (international) using passcode #13230091. A web archive will be available for 30 days at www.sirona.com.
+1-617-801-6888 (international) using passcode #13230091. A web archive will be available for 30 days at www.sirona.com.
About Sirona Dental Systems, Inc.
Sirona, the dental technology leader, has served dealers and dentists worldwide for more than 130 years. Sirona develops, manufactures, and markets a complete line of dental products, including CAD/CAM restoration systems (CEREC), digital intra-oral, panoramic and 3D imaging systems, dental treatment centers, and handpieces. Visit http://www.sirona.com for more information about Sirona and its products.
This press release contains forward-looking information about Sirona Dental Systems, Inc.’s financial results, guidance and estimates, business prospects, and products and services that involve substantial risks and uncertainties or other factors that may cause actual results, performance or achievements to be materially different from any future results, performance or achievements expressed or implied by such forward-looking statements. You can identify these statements by the use of words such as "may," "could," "estimate," "will," "believe," "anticipate," "think," "intend," "expect," "project," "plan," "target," "forecast", and similar words and expressions which identify forward-looking statements within the meaning of the Private Securities Litigation Reform Act of 1995. Such statements are not guarantees of future performance and involve known and unknown risks and uncertainties, and other factors. Readers are cautioned not to place undue reliance on such statements, which speak only as of the date hereof. For a discussion of such risks, uncertainties and other matters that could cause actual results to differ materially, including risks relating to, among other factors, the market for dental product and services, pricing, future sales volume of the Company's products, the possibility of changing economic, market and competitive conditions, dependence on products, dependence on key personnel, technological developments, intense competition, market uncertainties, dependence on distributors, ability to manage growth, dependence on key suppliers, dependence on key members of management, government regulation, acquisitions and affiliations and currency exchange rate fluctuations, readers are urged to carefully review and consider various disclosures made by the Company in its Annual Report on Form 10-K and in its reports on Forms 10-Q and 8-K filed with the U.S. Securities and Exchange Commission, which can be accessed through the SEC’s website, www.sec.gov . This presentation contains non-GAAP financial measures, which should not be viewed in isolation and do not purport to be an alternative to net income (loss) as an indicator of operating performance or an alternative to cash flows from operating activities as a measure of liquidity. The Company assumes no obligation to and expressly disclaims any obligation to update or revise any forward-looking statements contained in this document to reflect new information or future events or developments after the date any such statement is made.
* Non-GAAP adjusted EPS, constant currency growth and local currency growth and results are non-GAAP financial measures that exclude certain items. Please refer to “Reconciliation of GAAP and non-GAAP Information (unaudited)” in the attached exhibits for a description of these items.
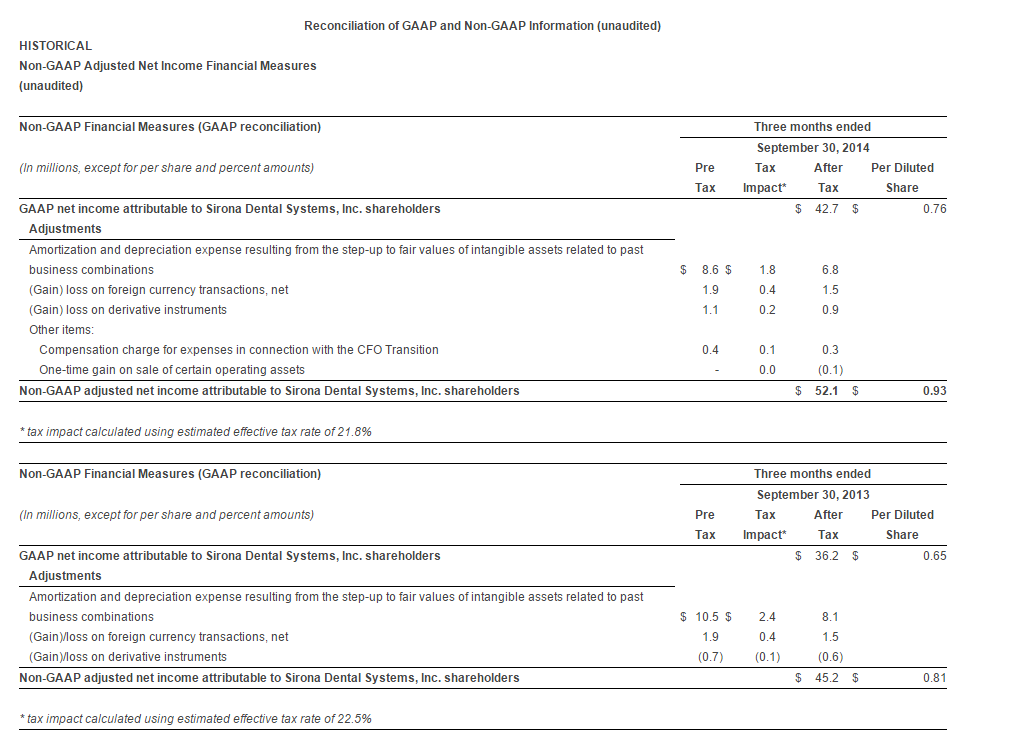
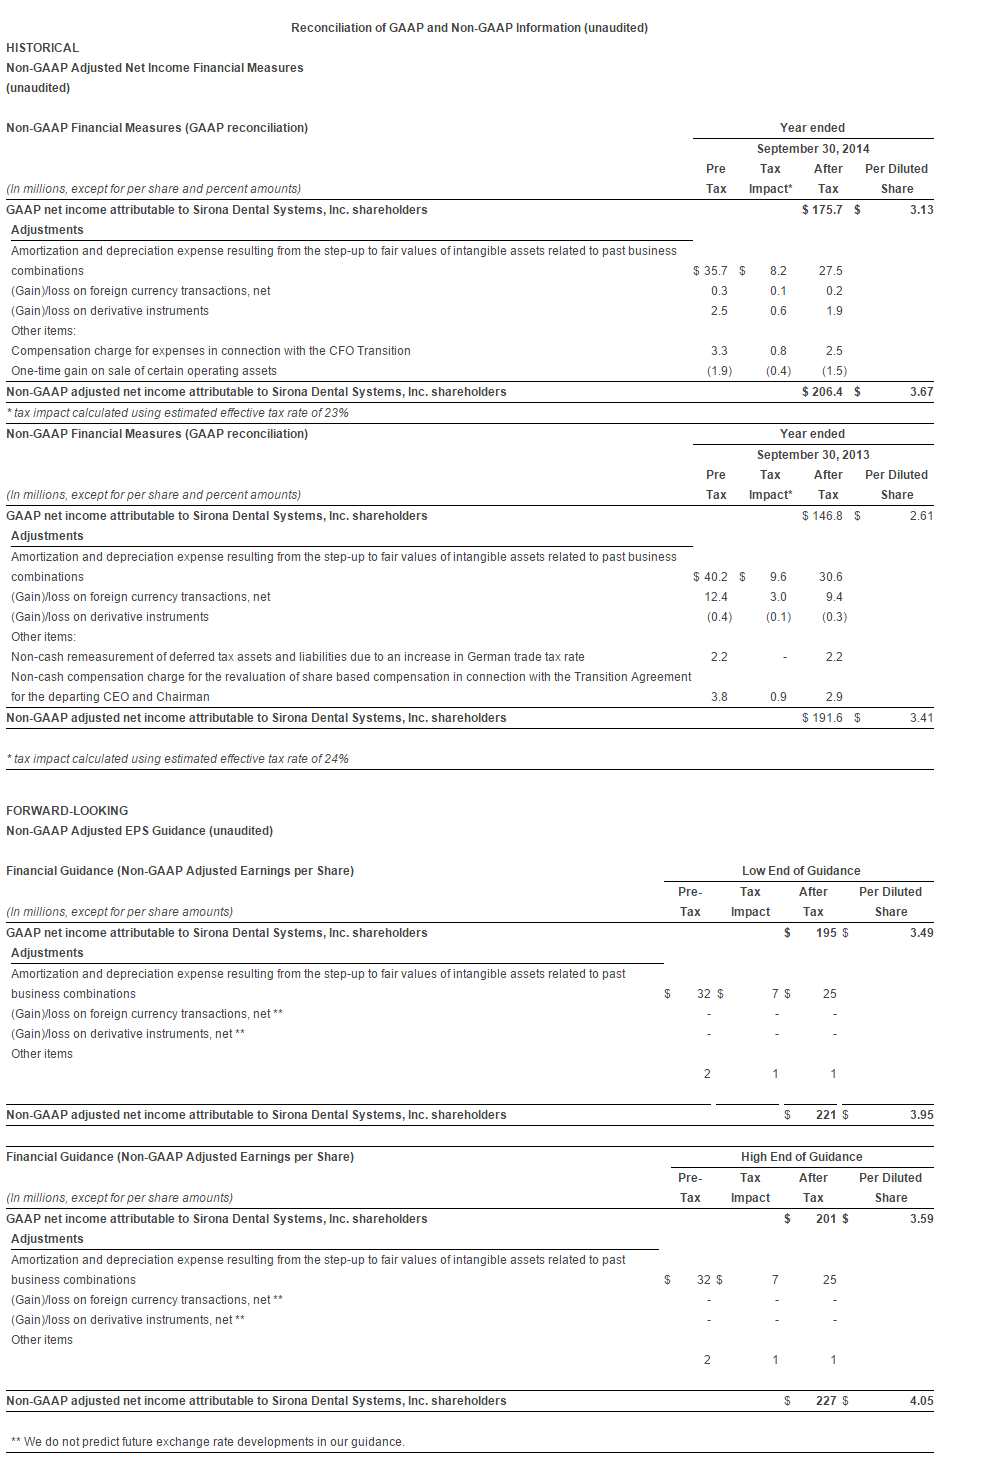
To supplement our consolidated financial statements and our business outlook, we use the following non-GAAP financial measures: (i) non-GAAP adjusted net income, and (ii) non-GAAP adjusted earnings per diluted share, which exclude, as applicable, amortization and depreciation expense resulting from the step-up to fair values of intangible and tangible assets related to past business combinations, gain/loss on foreign currency transactions, gain/loss on derivative instruments, any related tax effects, and to the extent relevant in a particular period, any other cash or non-cash items that management does not view as indicative of its ongoing operating performance. Also set forth above under the heading “FORWARD-LOOKING” are reconciliations of forward-looking non-GAAP financial measures to the most directly comparable GAAP financial measures.
Management recognizes that the use of these non-GAAP measures has limitations, including the fact that they might not be comparable with similar non-GAAP measures used by other companies and that management must exercise judgment in determining which types of charges and other items should be excluded from its non-GAAP financial measures. Management currently compensates for these limitations by providing full disclosure of each non-GAAP financial measure and a reconciliation to the most directly comparable GAAP measure. The presentation of this financial information is not intended to be considered in isolation or as a substitute for, or superior to, the financial information prepared and presented in accordance with GAAP.
We use these non-GAAP financial measures for financial and operational decision making and as a means to evaluate period-to-period comparisons. Our management believes that these non-GAAP financial measures provide meaningful supplemental information regarding Sirona’s operating performance in the ordinary, ongoing and customary course of its operations. Accordingly, management excludes the impact of acquisition-related intangible depreciation and amortization in order to compare our underlying financial performance to prior periods, certain charges related to currency revaluation of assets and liabilities that do not reflect our period-to-period core operating performance, and to the extent relevant in a particular period, any other cash or non-cash items that management does not view as indicative of its ongoing operating performance. We believe that both management and investors benefit from referring to these non-GAAP financial measures in assessing our performance and when planning, forecasting and analyzing future periods. These non-GAAP financial measures also facilitate management's internal evaluation of period-to-period comparisons. We believe these non-GAAP financial measures are useful to investors both because (1) they allow for greater transparency with respect to key metrics used by management in its financial and operational decision making and (2) they are provided to and used by our institutional investors and the analyst community to facilitate comparisons with prior and subsequent reporting periods.
Constant Currency: We have included certain revenue information in this press release on a constant currency basis. This information is a non-GAAP financial measure. We additionally present revenue on a constant currency basis because we believe it facilitates a comparison of our operating results from period to period without regard to changes resulting solely from fluctuations in currency rates.
Sirona calculates constant currency revenue growth by comparing current period revenues to prior period revenues with both periods converted at only the U.S. Dollar/Euro average foreign exchange rates for each month of the current period.
Sirona also calculates local constant currency revenue growth by comparing current period revenues to prior period revenues with all currencies for both periods converted at the prior period monthly exchange rates.
Our forecasted 2015 local currency net revenue growth guidance excludes the impact of exchange rate fluctuations due to the unpredictability of future changes in foreign exchange rates. Therefore, we do not provide a reconciliation of these measures.
Contacts
Sirona Dental Systems, Inc.
Joshua Zable, Vice President, Investor Relations, ![]() +1-718-482-2184
+1-718-482-2184
joshua.zable@sirona.com


