
Wisdom In Price Action
In my years of trading the financial markets, there is one principle that I believe in without exception. That principle is that price action will give a trader more information than he can find on his own. There are large hedge funds that pay millions of dollars to have information that the public doesn’t have. The only way to create a more level playing field is to understand that there is wisdom in price action.
The last few weeks have been a great example of this point. Rewind back to mid-October when the markets were tanking. The S&P 500 was down nearly -10% from its highs and seemingly getting weaker by the day. There were fears of an Ebola outbreak, Fed tapering stimulus to zero, a sharp slowdown in Europe and China, and much more. The markets looked absolutely terrible. However, in the midst of this chaos, the markets put in a significant bottom (shown below).
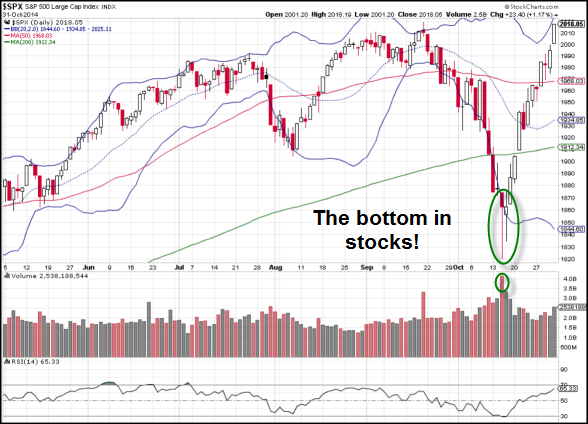
On October 15, the S&P 500 Index surged off of its lows and formed a hammer candlestick (in fact, every other major U.S. market did the same). The volume spike led to a new 52-week high for the S&P 500. This suggested aggressive capitulation on the downside. From there, the markets continued to rally over to new all-time highs and a larger than a +10% rally in just 12 trading sessions.
There was no great explanation for this rally. Ebola was still a concern and hadn’t been resolved. The Fed meeting came and went as expected with an end to QE. Europe and China continued to slow and each reported disappointing numbers in their economic data. So, what changed?
On October 31 (last Friday), the Bank of Japan (BOJ) surprised the markets with an announcement of more aggressive stimulus. This was surprising because the Japanese already had a stimulus package 50% larger than the U.S. at its peak – with an economy that was only 1/3 the size of the U.S. The BOJ announced that they would, in some cases, triple the current stimulus program…a program that was already so aggressive that the BOJ was literally buying stocks and ETFs in a last chance “Hail Mary.”
So, did the BOJ just wake up on October 31 and decide to install this stimulus program? Or, did they instead have this in motion since perhaps around October 15? In other words, did small investors have any idea that this was in the works for multiple weeks? The answer is, “YES,” but only if they followed the price action!
We like to put things into an easy and concise methodology for those who subscribe to our trading service at Investview.com. So, let’s do just that…
We can use an at-the-money option straddle to identify probability of price moves. The cost of a straddle is a one (1) standard deviation move from now to that expiration date. So, any move in a stock or market beyond two (2) standard deviations would be very extreme.
If the market makes a move outside of one standard deviation, then it is fair to say that the move is greater than was “statistically likely.” At that point, we needs to determine the piece of the story (either bullish or bearish) that we are missing. Often, we won’t get the answer to that question right away. For the BOJ announcement, it took a few weeks before the “aha” moment arrived.
The only way to level the playing field with institutions is to recognize price extremes. If you are on the wrong side of an unexplainable event, then simply close the trade. If you are in a trade that makes no sense, but is working, then continue to hold until the reason is known. Most professional traders will then sell on the news!
What are some current trending moves that are hard to explain?
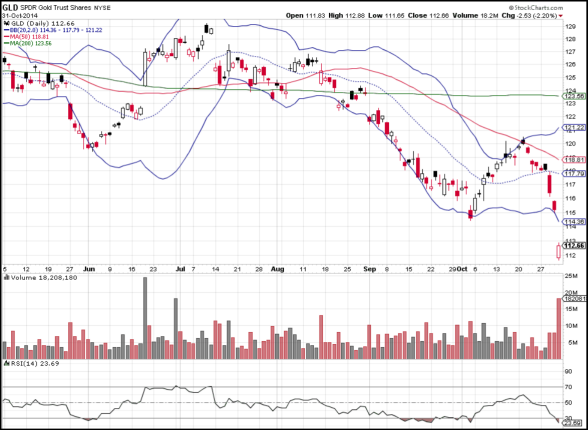
Central banks around the world continue to buy assets in an attempt to stimulate their economies and precious metals are tanking? Shouldn’t precious metals become most precious when currencies are being devalued with money printing measures? The answer is that the trend for Gold/Silver is down (see chart), so there must be more to the story!
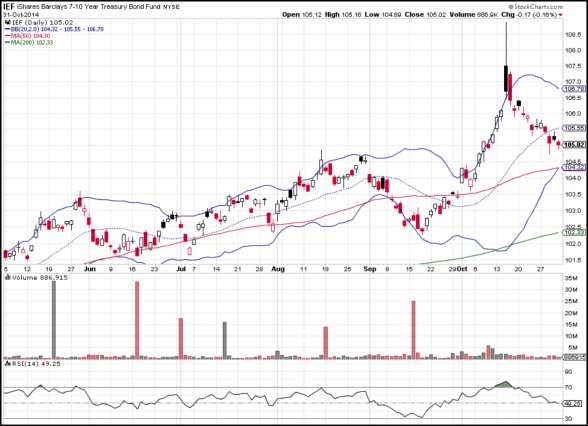
Bonds currently offer little to no value, with the 10-year Treasury bond paying little more than 2.0% annually. Why would bonds be in an uptrend when stocks have trended upward (see chart)? It can be even more perplexing when considering that the bonds pay little to no “real,” inflation-adjusted income, which is the main reason to buy bonds. The trend for 10-year Treasury bonds is up even when the fundamental value seems low, so there must be more to this story as well!
In our live classes, we discuss our Trading Team’s current analysis of the markets. Lately, we have been discussing the wisdom of avoiding both buying precious metals and shorting bonds. While each of these trades would seem to make sense on the surface, there is wisdom in price action and that principle is one to always respect!
Gold ETF (GLD)
iShares 7-10 Year Treasury Bond ETF (IEF)
Disclosure: None


