
A Rational Look At Stock Market Risk
No Fear Mongering, Just Facts
Group of 20 finance chiefs and central bankers said current risks include uneven growth and the possibility of excessive risk-taking in a low interest rate environment. They also pointed out that when push comes to shove, they will continue to stimulate. From Bloomberg:
“It is critical that we take concrete steps to boost growth and create jobs,” Australian Treasurer Joe Hockey, who hosted the meeting, told reporters after the communique was released. “We will use all levers available, including additional fiscal and monetary policy leverage where appropriate.”
This Is What Risk-Off Looks Like
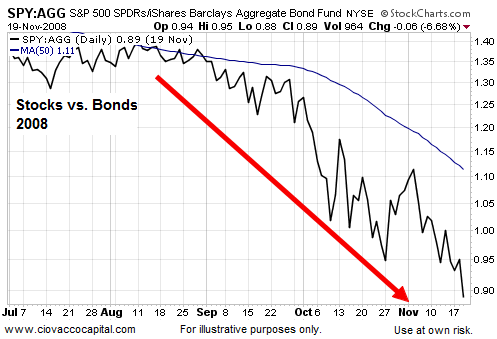
If an increasing threat of a global recession is the primary concern, we would expect more conservative assets to be gaining traction. Investor preferences allow us to better understand the stock market’s risk-reward profile. For example, when economic fear was high in 2008, the performance of growth-oriented stocks SPY was weak relative to defensive-oriented bonds AGG (see chart below).
This is What Risk-On Looks Like
When fear started to subside in March 2009, equities started to outperform bonds, telling us the risk-reward profile of the general stock market was improving.

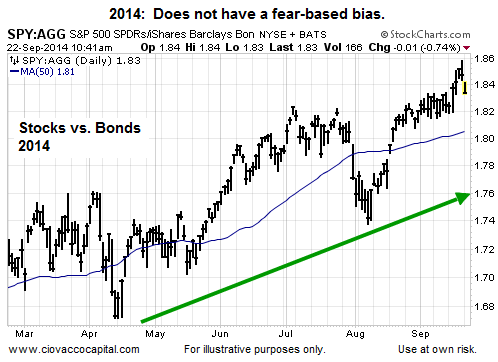
This Is What Today Looks Like
How does the same ratio look now? September 22, 2014 still looks similar to the “risk-on” period in 2009 rather than the “risk-off” period in 2008, which tells us the bias is still bullish looking out weeks and months. The chart below includes the weak open in stocks on September 22.
But, Bonds Are Impacted By The Fed
A fair criticism of the analysis above is “you can’t rely on those charts in a rising rate environment”. If the stock vs. bond charts are skewed, we can offset that by looking at stocks in isolation. This week’s stock market video compares the S&P 500 in 1987, 2002, 2003, 2007, and 2009 to the present day.
After you click play, use the button in the lower-right corner of the video player to view in full-screen mode. Hit Esc to exit full-screen mode.
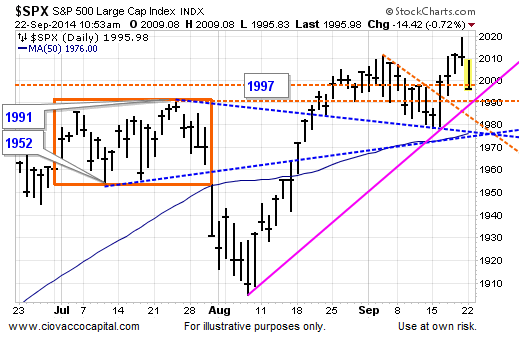
Investment Implications - The Weight of The Evidence
Even with the S&P 500 down 14 points during Monday’s session, the intermediate-term trend in stocks remains up (see slope of blue 50-day below). Buyers could step in near various forms of possible support between 1975 and 1997.
How long will the bullish trends hold? We don’t know and we do not need to know if we are willing to pay attention meticulously and make portfolio adjustments when the observable evidence changes in a meaningful way. The process could start soon, but for now Monday’s weakness still falls into the “normal and expected volatility within the context of a favorable trend” category. Therefore, we continue to hold stocks SPY, leading sectors XLK, and some offsetting exposure to bonds TLT.
Disclosure: None.


