
ADR Best And Worst
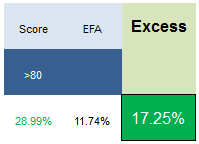
Our top scoring ADRs from one year ago (9/9/2013) have outpaced the EFA by 17.25% in the past year. Returns have been led by YPF up 93%, BMA up 89%, and GGAL up 69%.
ADRs Best & Worst Report
The average ADR score is 56.59, below the four week moving average score of 56.70. The average ADR is trading -16.38% below its 52 week high, 1.97% above its 200 dma, has 4.26 days to cover held short, and is expected to post EPS growth of 18.83% next year.
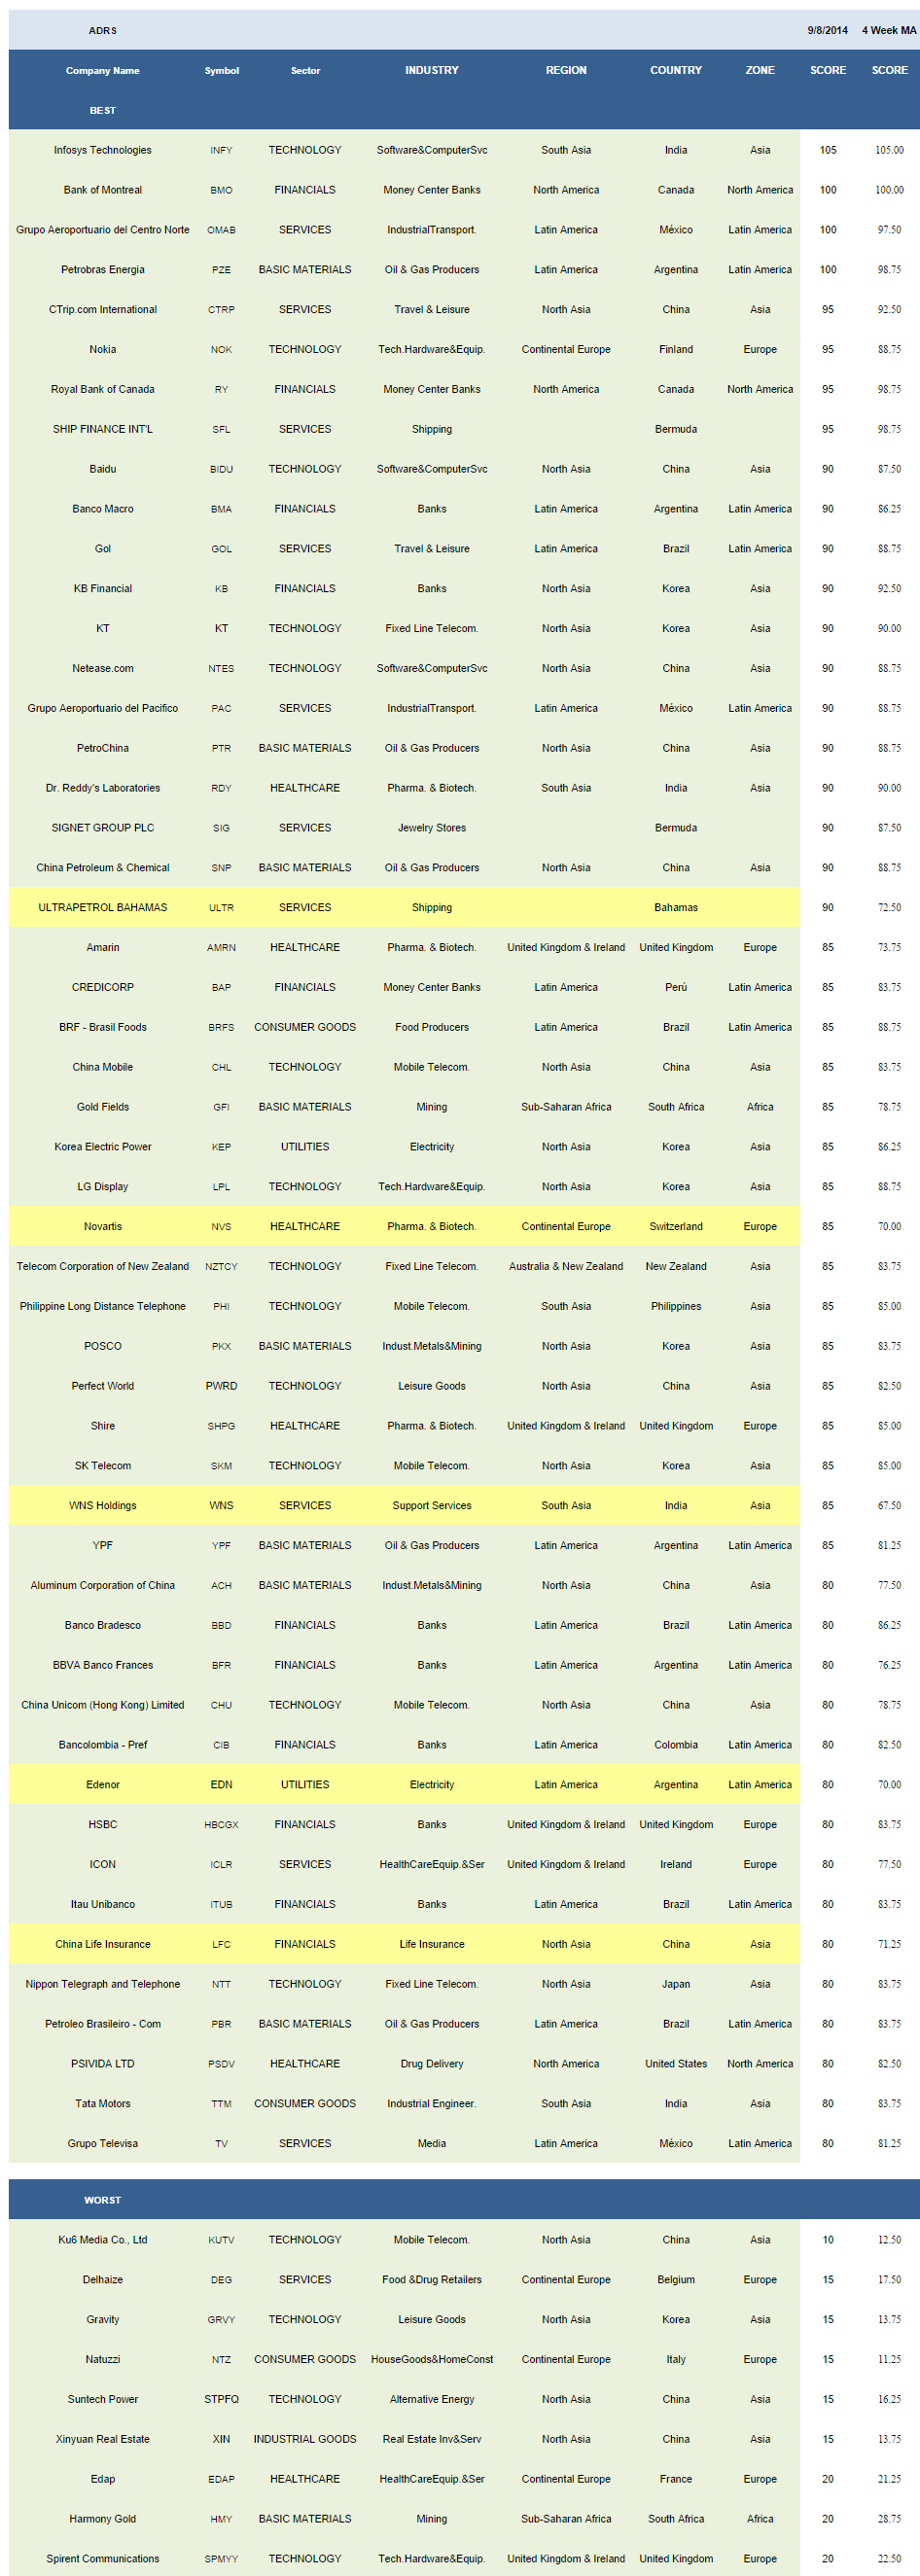
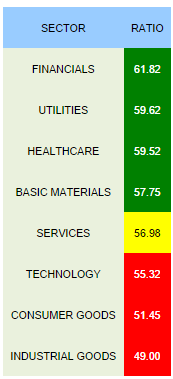
The best scoring ADR industry is financials (BMO, RY, KB, BMA, BAP, LFC, ITUB, HBCGX, CIB, BFR, BBD). Utilities (KEP, EDN, ELP, HNP), healthcare (RDY, SHPG, NVS, AMRN, PSDV), and basic materials (PZE, SNP, PTR, YPF, PKX, GFI, PBR, ACH) also score above the ADR universe average score. Services score in line. Technology, consumer goods, and industrial goods score below average.
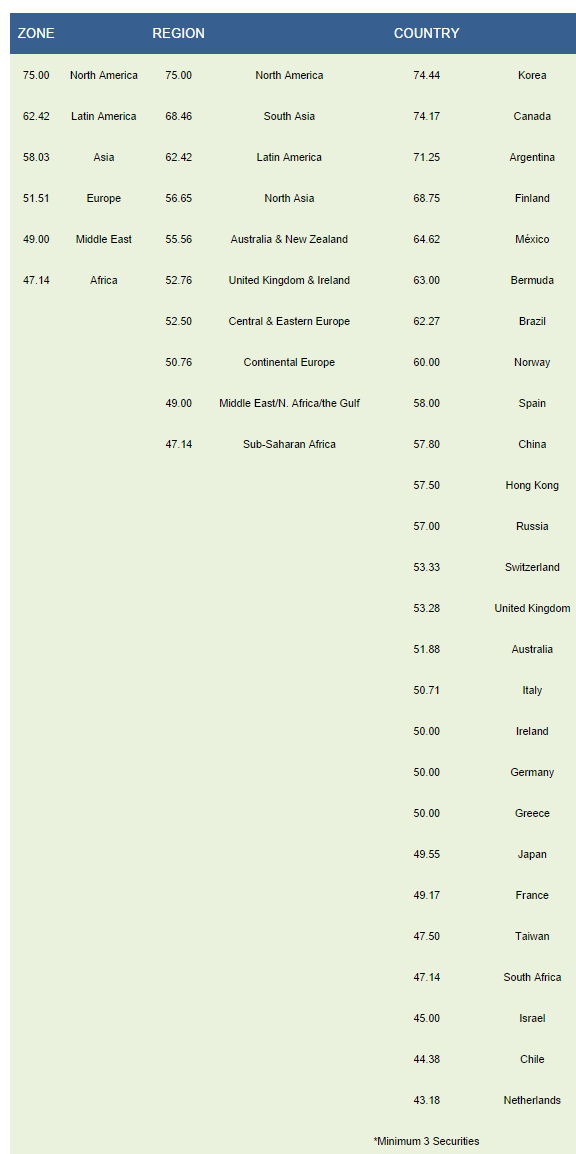
North America/Canada (BMO, RY, PSDV, BCE) and Latin America (OMAB, PZE, PAC, GOL, BMA, BAP, BRFS, YPF, EDN, TV, ITUB, CIB, BFR, BBD, PBR) are the top scoring zones. North America, South Asia (INFY, RDY, PHI, WNS, TTM, IBN), and Latin America are the best scoring regions. Korea (KT, KB, KEP, SKM, LPL, PKX), Canada (BMO, RY, BCE), Argentina (PZE, BMA, YPF, EDN, BFR), Finland (NOK, MXCYY), and Mexico (OMAB, PAC, TV, ASR, IBA) are the best scoring countries.
Disclosure: None.


