
Could The S&P 500 Fall To 1,625?
A Trip Down Correction Memory Lane

Since the correction-less market theory has been dropping transmission parts over the last three weeks, it is prudent to revisit some topics we have touched on in the past. We will focus on two questions:
- How far can stocks drop?
- How long can corrections last?
History Says Corrections Can Be Very Painful
Our objective here is not to create fear, but rather to better understand what is in the realm of historical possibility. If we understand the magnitude and duration of some of the sharper corrections (1983-2011), we can better prepare for all possible market outcomes.
S&P 500 At 1,625…Is That Possible?
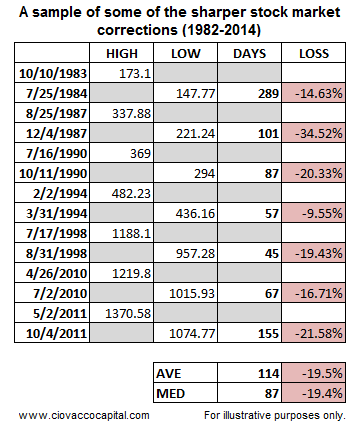
In the seven historical cases below, the average correction in the S&P 500 was 19.5%. The average length of the seven cases was 114 calendar days (top to bottom). The S&P 500 peaked on September 19, 2014 at 2,019. A 19.5% drop would be 394 points, which would take the S&P 500 to 1,625. A correction of 114 days would end on January 11, 2015. Regular readers know we are not fans of forecasting (rationale here). Therefore, this is not a forecast…it is simply an educational exercise regarding some of the more painful stock market corrections. Admittedly, this is anecdotal evidence, but we can still learn from it.
Sample of Corrections 1982-2014
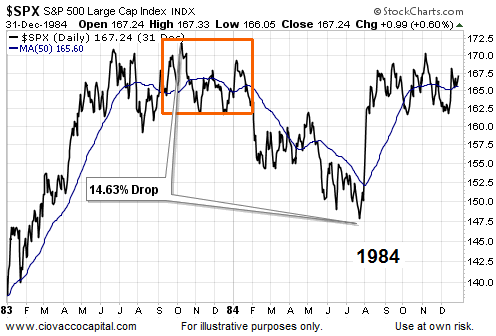
In 1984, stocks dropped 14.63%. Unlike the multiple-day pullbacks in 2013 and 2014, this correction lasted two hundred eighty-eight calendar days (288).
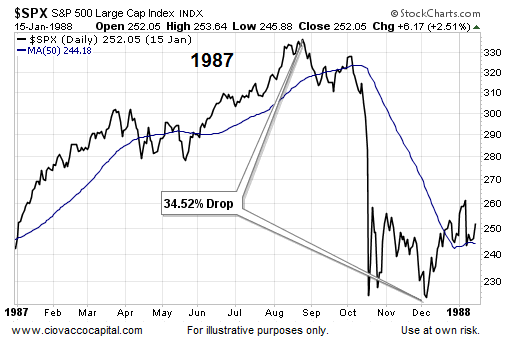
The 1987 stock market crash occurred within the context of a bull market, and the bull market resumed relatively quickly. Therefore, it is relevant to our correction study and 2014.
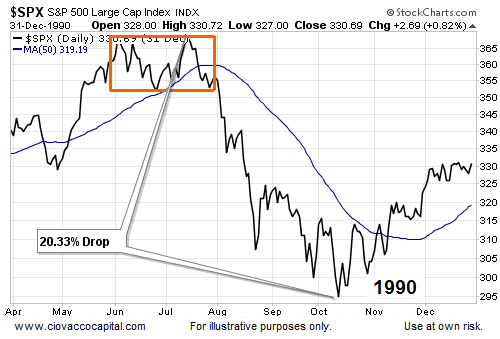
In 1990, stocks corrected sharply, dropping 20% over eighty-seven calendar days.
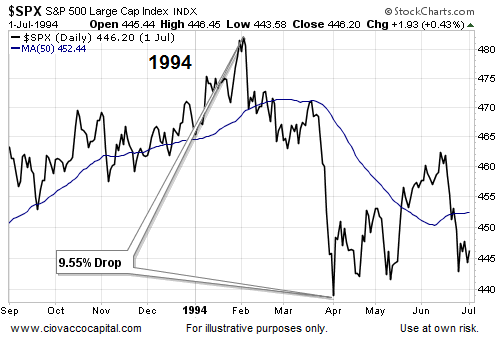
We have covered the importance of the investment landscape in 1994 numerous times, including this March 21 article. Stocks slid just under 10%.
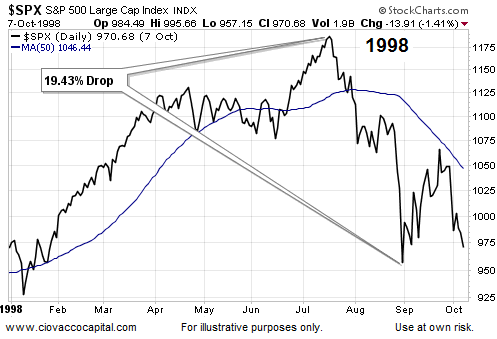
In 1998, the correction may have felt like a bear market based on the sharp declines witnessed on brokerage and 401k statements. The 1998 correction was outlined in more detail on April 2.
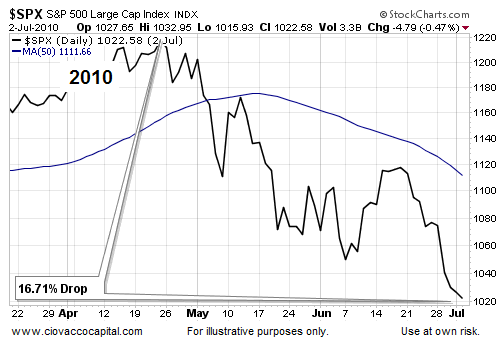
The 2010 Flash Crash was quite a bit more than a one-day media event. Stocks dropped 16.71% over sixty-seven calendar days.
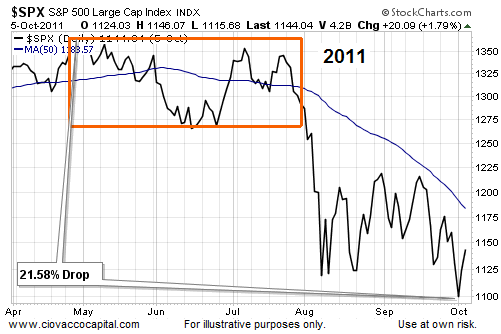
A political stalemate in Washington and escalating fears of the end of the euro, helped push stocks down over 21% in 2011.
Corrections Can Be Harmful To Your Portfolio’s Health
The details on the seven cases are shown in the table below. Can corrections be less painful? Sure, there are countless examples of more shallow pullbacks. However, understanding what is possible helps with investment contingency planning.
Investment Implications - The Weight Of The Evidence
Did the evidence in recent weeks suggest something was changing from a risk-tolerance perspective? The tweet below is from September 22. Since noting “the math (evidence) is vulnerable here”, the S&P 500 has dropped 131 points.

As noted in an October 10 video, this is a high risk market until proven otherwise, markets can turn at anytime; therefore, objectivity and flexibility are requirements. When emotions are running high, market levels can assist with decision making. Our market model came into today’s session with a heavy cash position paired with bonds (TLT). We still have some stocks (XLK) left on the books. If the S&P 500 fails to hold Wednesday’s low of 1,820, we will consider cutting the already depleted equity side of our portfolios (again).
Book image (altered) from Chris via Flickr
Disclosure: None.


