
T2108 Update – A Market Launching Pad
T2108 Status: 63.2%
T2107 Status: 51.9%
VIX Status: 13.7 (fresh 5-week closing low)
General (Short-term) Trading Call: Aggressive bears should have stopped out of most shorts by now; bulls can of course continue holding
Active T2108 periods: Day #14 over 20%, Day #12 over 30%, Day #9 over 40%, Day #7 over 50%, Day #2 over 60% (ending 1 day under 60%), Day #84 under 70%
Reference Charts (click for view of last 6 months from Stockcharts.com):
S&P 500 or SPY
SDS (ProShares UltraShort S&P500)
U.S. Dollar Index (volatility index)
EEM (iShares MSCI Emerging Markets)
VIX (volatility index)
VXX (iPath S&P 500 VIX Short-Term Futures ETN)
EWG (iShares MSCI Germany Index Fund)
CAT (Caterpillar).
Commentary
T2108 closed at 63.2% so no overbought conditions to increase the drama of the U.S. jobs report for October. This report should effectively be a “last stand” for the bears although I actually cannot remember the last time a jobs report generated significant selling on the S&P 500 (SPY). With the index closing at yet another all-time high, increasing its distance from the psychologically important round number of 2000, and crawling upward through the neat upward trend channel created by the two Bollinger Bands (BB), the S&P 500 looks like it is carving out a launching pad for a fresh run-up. The Bollinger Bands are wide open and carving out a path pointing upward.
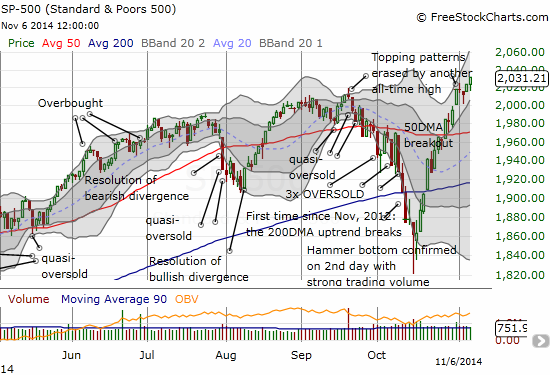
Back to recurring all-time highs – topping patterns obliterated
I am spending the rest of this update with some chart reviews that I find very compelling for bullish and bearish reasons. Ironically enough, mostly bearish reasons.
First, the bullish pictures (more or less!).
GoPro, Inc. (GPRO)
The market cannot decide what to think of GPRO’s earnings. On August 1st, the stock gapped down post-earnings only to recover and soar ahead of the October 31st earnings report. The stock gapped UP after its second earnings report as a public company, but it has not quite beaten out the previous (pre-earnings) high. Now it looks like the 50DMA is an important pivot point. GPRO has been a great trading stock, and I am now looking for the 50DMA to keep support. A breakout or breakdown should lead to a sustained follow-through of trading.
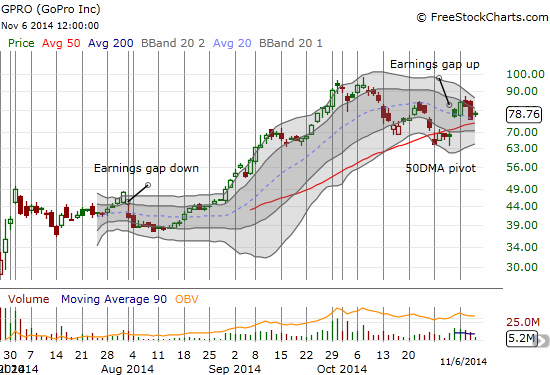
GoPro, Inc. (GPRO) has had one unstoppable run. I expect the next run, up or down, to be just as unstoppable
Baidu, Inc. (BIDU)
After July earnings I was very bullish on BIDU and waited for a dip to make the next trade. It came, but I was not rewarded as the stock continued to consolidate. I caught September’s bounce off 50DMA support. But after that run-up ended quickly, I got wary and concerned that BIDU had just printed the dreaded triple top. The October breakdown seemed to confirm the top. Earnings on October 29th took care of those concerns with the stock printing a fresh all-time high. I finally got in long again as the stock pulled back “gently” to the bottom of what I think is now a fresh upward trending channel between the two Bollinger Bands.
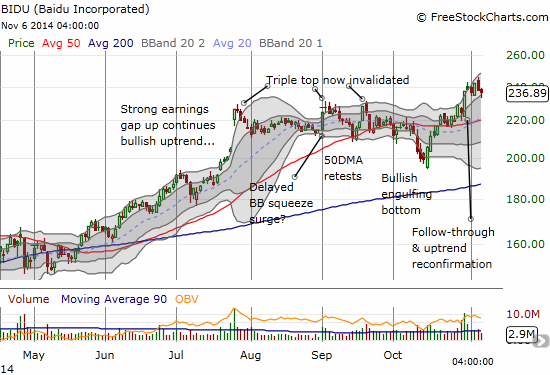
Baidu, Inc. (BIDU) invalidates the triple top in convincing post-earnings fashion
Wix.com Ltd. (WIX)
I noted WIX back in June for what looked like a very strong breakout above its 50DMA. Since then, the stock has effectively gone nowhere in a very extended consolidation period oscillating around the 50DMA. Two sets of earnings have failed to break the stock out of its range. I include this in the bullish camp because the stock has held up relatively well, especially through the sharp market correction in October. An eventual breakout could deliver a very powerful upside move. A breakdown will still need to break the all-time low from May to cause me significant alarm.
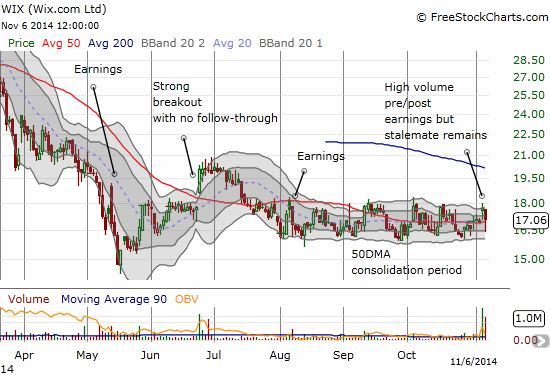
Wix.com Ltd. (WIX) in a holding pattern
I know there are still plenty of stubborn bears out there. The next charts should give them a glimmer of hope that they have plenty of fields for frolicking even if the general market continues to contradict their dour moods.
Google Inc. (GOOG)
GOOG was one of my favorite post-earnings plays coming out of October’s oversold conditions. Its earnings were perfectly timed – right as the general stock market got slammed for the final time. The sharp post-earnings bounce demonstrated that the market likely over-reacted to GOOG’s earnings but could not help itself given the negative sentiment in the air. However, GOOG’s chart is sagging again. It printed a topping pattern right below a declining 50DMA with convincing follow-through selling. Moreover, it is looking like July’s earnings marked a lasting top in the stock. GOOG has to set a fresh post-earnings low to confirm a fully bearish move.
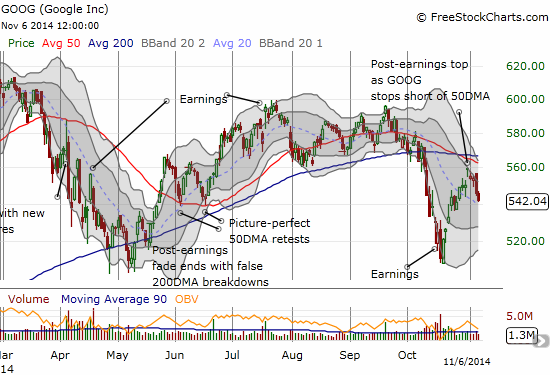
Google Inc. (GOOG) is sagging again as its post-earnings reversal has lost momentum
iShares MSCI Emerging Markets (EEM)
EEM was another great play coming out of oversold conditions. The call options were extremely cheap at the time. NOW, EEM has failed to break resistance at its 200DMA twice. The 50DMA is quickly descending. There is now a red flag planted directly over EEM. I only want to try another long (outside of oversold conditions) after a breakout above resistance. A break of the October low confirms a new downtrend.
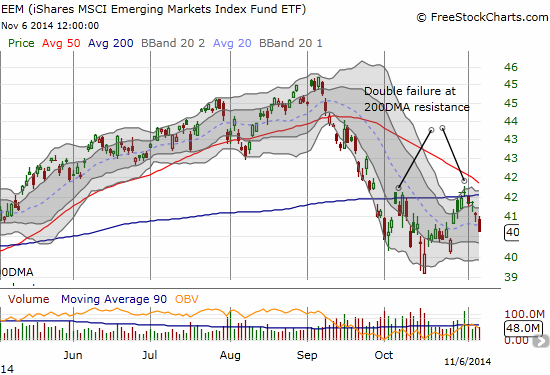
iShares MSCI Emerging Markets (EEM) looks like it is in trouble with a double failure at resistance
zulily, Inc. (ZU)
I offered up ZU as a way to play traditional strength in retail stocks in the second half of the year. I should have stuck to an ETF of retail stocks. ZU went absolutely nowhere aftermy recommendation in June…until earnings this week took the stock to (marginal) all-time lows. For now, I am hanging on to see what happens in the post-earnings follow-through period.
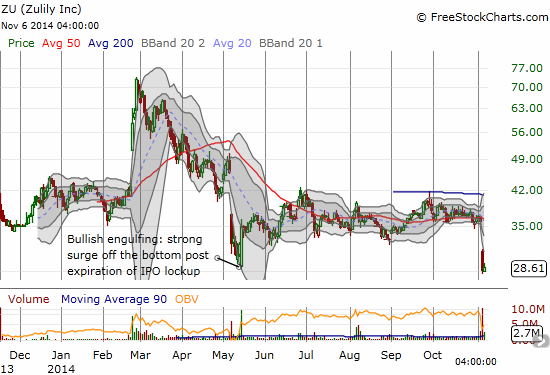
zulily, Inc. (ZU) disappoints – can it recover in time for Christmas?
SolarCity Corporation (SCTY)
Unlike BIDU, SCTY has definitively confirmed its triple top. BIDU’s triple top occurred at all-time highs while SCTY’s happened at sub-all-time highs. This distinction could have made all the difference in sentiment. The stock has broken through 50 and 200DMA support and recently failed at 50DMA resistance with significant selling that has picked up post-earnings. A new 2014 low would represent a major breakdown for SCTY and would likely invite a LOT of follow-up selling.
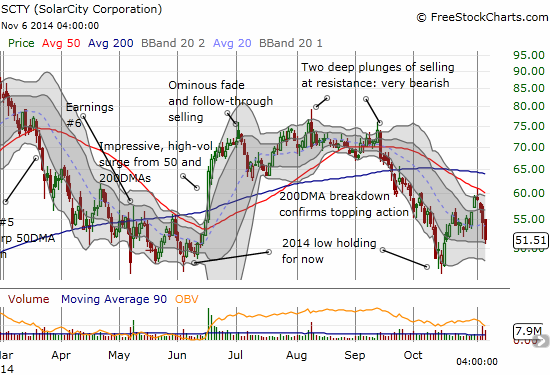
SolarCity Corporation (SCTY) may be a major breakdown in the making. It is definitely worth a bright, red flag.
Daily T2108 vs the S&P 500

Black line: T2108 (measured on the right); Green line: S&P 500 (for comparative purposes)
Red line: T2108 Overbought (70%); Blue line: T2108 Oversold (20%)
Weekly T2108

*All charts created using freestockcharts.com unless otherwise stated
Full disclosure: long SSO shares, long BIDU call options, long GOOG call ...
more

