
T2108 Update – An S&P 500 Breakout To The Upside Target – Now What?
T2108 Status: 55.3%
T2107 Status: 48.9%
VIX Status: 14.4 (falls 10%, uptrend breaks, and VIX goes below 15.35 pivot)
General (Short-term) Trading Call: Aggressive bears should have stopped out of shorts, bulls take a few profits, otherwise hold. 50DMA breakout puts bulls back in control.
Active T2108 periods: Day #8 over 20%, Day #6 over 30%, Day #3 over 40%, Day #1 over 50% (ending 31 days under 50%), Day #36 under 60%, Day #78 under 70%
Reference Charts (click for view of last 6 months from Stockcharts.com):
S&P 500 or SPY
SDS (ProShares UltraShort S&P500)
U.S. Dollar Index (volatility index)
EEM (iShares MSCI Emerging Markets)
VIX (volatility index)
VXX (iPath S&P 500 VIX Short-Term Futures ETN)
EWG (iShares MSCI Germany Index Fund)
CAT (Caterpillar).
Commentary
The bears failed the test…miserably. As I anticipated from my last T2108 Update, the major indices were indeed setup for a major breakout above their 50DMAs. The S&P 500 (SPY), the NASDAQ (QQQ), and even iShares Russell 2000 (IWM) ALL broke out decisively above their respective 50-day moving averages (DMAs).
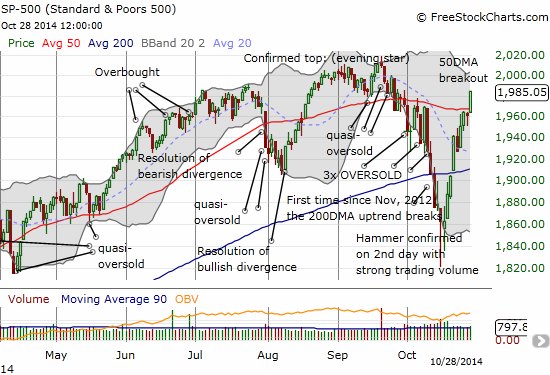
The S&P 500 makes a very convincing breakout above 50DMA resistance
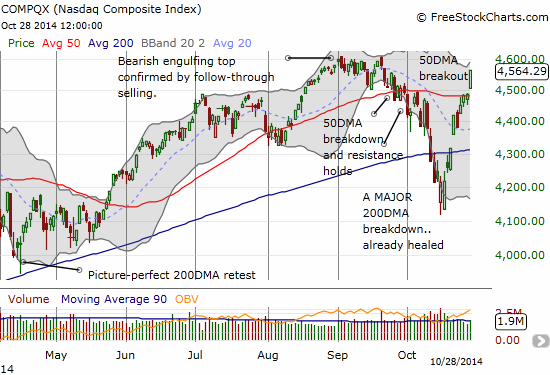
The NASDAQ CONFIRMS its 50DMA breakout with an exclamation point
Despite the doubts, iShares Russell 2000 (IWM) also managed to print a major 50DMA breakout.
Friday's trades on RealMoneyPro: Added to YHOO long, re established Russell (IWM) short, pressed SPY/QQQ shorts, re established CAT short.
— Douglas Kass (@DougKass) October 27, 2014
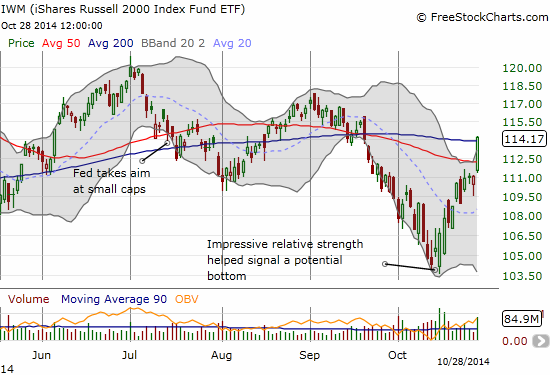
Even iShares Russell 2000 (IWM) manages to make a major 50DMA breakout that reaches as far as its 200DMA
Speaking of Caterpillar (CAT), it has (surprisingly) managed to reconquer the psychologically important $100 level. It is now directly under converging 50 and 200DMA resistance. This position now makes CAT a more perfect hedge on long positions than ever. HOWEVER, experience has taught me that these converging forms of resistance rarely hold, especially without some direct and related catalyst to provide the selling pressure.
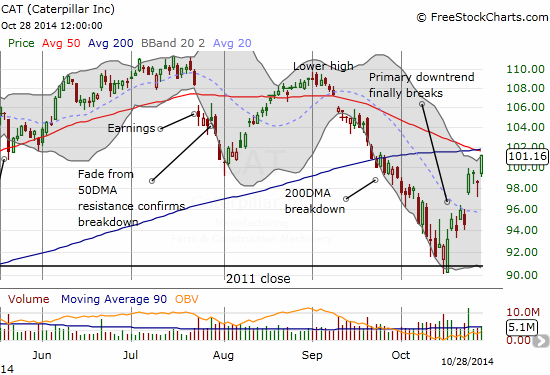
CAT bottomed with the stock market and is now providing the rallies next critical (proxy) test at converged 50 and 200DMA resistance
The strong rally in the stock market helped to escort the volatility index on a rapidly descending escalator that sent ProShares Ultra VIX Short-Term Futures (UVXY) right back to very familiar territory.
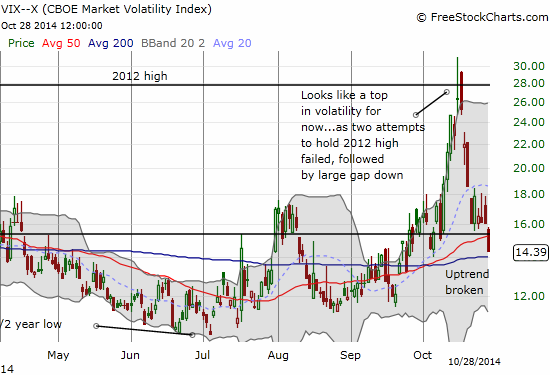
The volatility index collapses again – seemingly ending what I thought would be a longer lasting uptrend bias
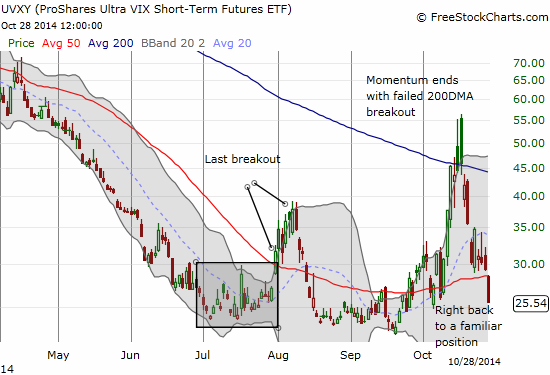
In a flash, ProShares Ultra VIX Short-Term Futures (UVXY) is right back to a very familiar position
The advantage clearly goes back to the bulls even with all-time or multi-year highs still looming above as resistance. Bulls can now buy FRESH positions with stops below the 50DMA. Bulls can hold positions and wait to see what happens when (if?) the highs get re-challenged. Bulls can especially take some more profits from hard-earned positions opened during the recent oversold periods.
T2108 closed at 55.3%, well-off a new overbought period, yet, the S&P 500 has already hit my 1985 target. In fact, almost on the nose! This means that if the S&P 500 continues higher into overbought conditions, it will produce a rare period where the 70% underperiod produces a positive gain for the S&P 500. That is, the drop from and return to overbought conditions would deliver a positive S&P 500 performance. Seeking consistency with the historical behavior in T2108, I am watching now for a period of significant churn that allows T2108 to increase much more slowly with overbought conditions conveniently triggering at the recent highs.
Given my bullishness going into this week, I bought ProShares Ultra S&P500 (SSO) call options into Monday’s dip. This was one of several positions in other stock setups. Tuesday delivered bigtime with the breakouts shown above, and I closed out the SSO call options with a cool double. I am still holding onto my SSO shares purchased during the oversold period. The breakout gives me renewed confidence, but it also now provides a clear stop for exiting the position if needed.
There are some traders who are just now getting bullish given the clearance of the technical hurdles. The waiting is understandable from a conservative risk/reward standpoint, but these traders now have to wait out a breakout to fresh highs for a big payoff. The real reward was in sticking to the trading rules during the oversold period. The latest big move only further validates my technical case for a bottom in the stock market. The breakout makes me a little more aggressive on buying dips as long as T2108 stays below overbought territory (70% or higher) and the S&P 500 above its 50DMA.
I continue to be bemused by the bears who are overly focused on the trees and forgetting the forest. The latest excited shouts of glee (on twitter anyway) offering “proof” of the bearish thesis have come from the 10% or so after hours post-earnings drop by Facebook (FB). While I continue to short FB as part of a hedged strategy I laid out a long while ago, I do not see FB’s stumble as proof of any over-arching bearish thesis. The forest is rapidly healing all around the few fallen (hyper-expensive) stocks. The oversold period was all about panic over everything under the sun that could possibly produce worry and concern. It was a technical breakdown and a violent one at that. The end of the oversold period and the subsequent buying on volume has been all about putting those fears to bed and in the rearview mirror. It is a technical recovery in that it has pressed reset on the prior technical breakdown. The poor reactions to a few over-valued stocks do not change the larger picture.
Moreover, it is so much better to follow the technicals here than to go through the extremely difficult exercise of staking a claim to a market top. Exhibit A is Alibaba Group Holding Limited (BABA).
It was the Ali Blah Blah Top The IPO coincided with a peak in complacency, a fervor in IPO/m and a steady deterioration and narrowing of mkt
— Douglas Kass (@DougKass) October 8, 2014
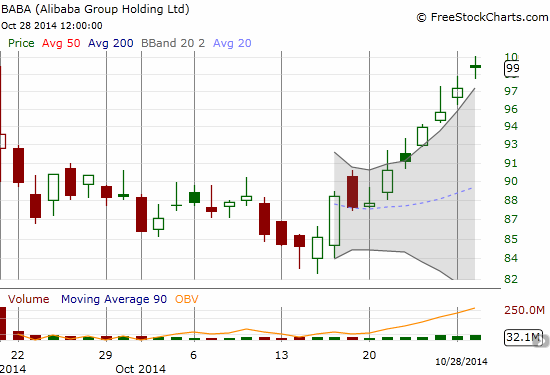
Alibaba Group Holding Limited (BABA) is now sprinting higher…
Today (October 28th), BABA made a marginal new all-time high before closing right at tits all-time intraday high. BABA as made four straight new closing all-time highs in a row now. This is NOT the behavior of a stock that has signaled a market top. As a technical signal, believers in an “Ali Blah Blah top” should now recognize the red flag on the thesis and ponder the possibilities for the stock market to soar right past the highs set in mid-September at the time of BABA’s IPO. Something tells me the introspection and re-examination will not happen.
Fortunately, the 50DMA breakout has made the trading call very simple and BABA-independent. Shorts placed in anticipation of of firm 50DMA resistance should have been stopped out. Traders following the T2108 rules are OK to take a few more profits here, especially to fund future purchases on the next dips and or to sit tight through any coming retest of 50DMA as (now) support.
Daily T2108 vs the S&P 500

Black line: T2108 (measured on the right); Green line: S&P 500 (for comparative purposes)
Red line: T2108 Overbought (70%); Blue line: T2108 Oversold (20%)
Weekly T2108

*All charts created using freestockcharts.com unless otherwise stated
Full disclosure: : long SSO shares, short FB, long FB call options and ...
more

