
T2108 Update – Another Follow-Through On Divergence…But This Time Is Different
(T2108 measures the percentage of stocks trading above their respective 40-day moving averages [DMAs]. It helps to identify extremes in market sentiment that are likely to reverse. To learn more about it, see my T2108 Resource Page. You can follow real-time T2108 commentary on twitter using the #T2108 hashtag. T2108-related trades and other trades are posted on twitter using the #120trade hashtag)
T2108 Status: 34.7%
VIX Status: 14.1%
General (Short-term) Trading Call: Hold (Aggressive traders can short with tight stops)
Active T2108 periods: Day #309 over 20% (includes day #280 at 20.01%), Day #25 over 30%, Day #2 under 40% (underperiod), Day #5 under 50%, Day #8 under 60%, Day #49 under 70%
Reference Charts (click for view of last 6 months from Stockcharts.com):
S&P 500 or SPY
SDS (ProShares UltraShort S&P500)
U.S. Dollar Index (volatility index)
EEM (iShares MSCI Emerging Markets)
VIX (volatility index)
VXX (iPath S&P 500 VIX Short-Term Futures ETN)
EWG (iShares MSCI Germany Index Fund)
CAT (Caterpillar).
Commentary
Another quiet divergence, another follow-through. Except THIS time is different.
If you only looked at the S&P 500 (SPY), you would think Monday was a surprisingly boring day. In fact, you might think that it was a bullish day given buyers picked up the index off 50-day moving average (DMA) support.
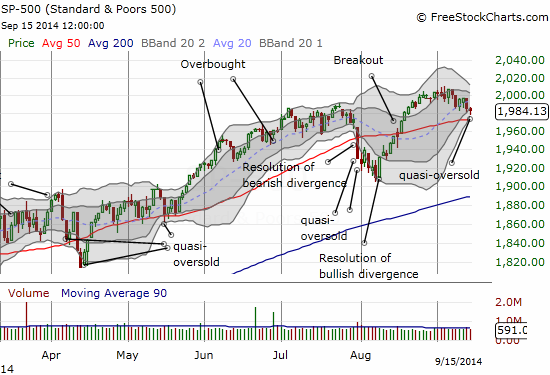
The S&P 500 bounces near 50DMA support to close essentially flat on the day – a nice hammer pattern
But next you might wonder why the volatility index, the VIX, crept higher by 6% to one-month highs.
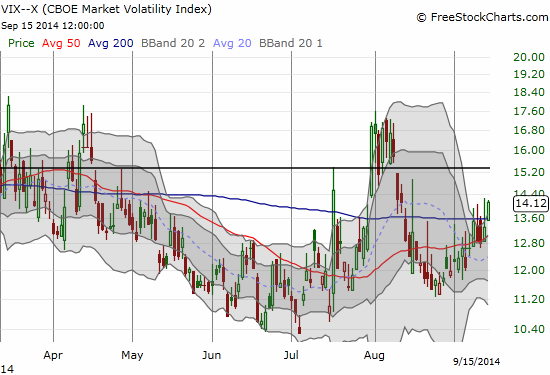
The VIX gains a little again and hits a 1-month high
So next you look at the NASDAQ (QQQ) and realize that the potentially bullish bounce for the S&P 500 is likely wiped out completely by the very bearish confirmation of a top for the tech-laden index.
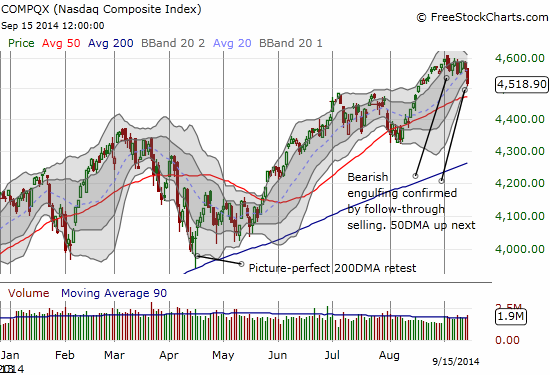
The NASDAQ confirms the bearish engulfing top – setting up a critical retest of 50DMA support
At this point, your instincts should point you to trusty ol’ T2108, the percentage of stocks trading above their 40DMAs…if you have not already done so. Lo and behold, you find T2108 dropped another sizable amount, this time by 9.5% to close at 34.7%. This means that under the surface of the market, a bunch of stocks are still sliding rather dramatically. Indeed, as I continue with the chart review, you will see a sample of some of the carnage from today’s selling. Momentum and otherwise highly-valued stocks got hit particularly hard today.
This time is different from the other two examples we have seen of important T2108 vs S&P 500 divergences is that the immediate resolution was only in select stocks. If you had focused on shorting the S&P 500, you would have missed the best plays.
Looking for some positive signs, regular readers know at this point that a large 2-day decline in T2108 generates a “quasi-oversold” trading condition. The 2-day decline of 29.2% has been swift and dramatic. Unfortunately, instead of predicting a bounce, the T210 Trading Model (TTM) is predicting high odds (71%) of more selling (on the S&P 500) for Tuesday. The only solace for the bullish minded is that the classification error is extremely high for the model (45%). However, if you look just at the historical fit, the error rate for a prediction of a loss (or a gain) is only 22%. Consider it a toss-up filled with caution.
With technology identified as the likely culprit, your chart checks should get into high gear.
I checked some of the usual suspects for confirmation that the market attacked with ferocity: Renaissance IPO ETF (IPO), Global X Social Media Index ETF (SOCL), and iShares Russell 2000 (IWM). It just so happens that there are a LOT of potential catalysts this week to motivate selling. For example, there is a Federal Reserve meeting on Wednesday that has the market jittery about hawkishness (oh how quickly the narratives change!), maybe Chair Janet Yellen even takes aim at the valuations of small-caps and social media stocks. A blockbuster IPO from Alibaba (BABA) likely has big traders and investors cashing out of big name, highly liquid stocks to pay for the shares of the century. And there is a triple-witching (or is it quadruple?) options expiration on Friday. In forex, the sudden weakness in the (formerly) stubborn Australian dollar is confirming bearishness all around.
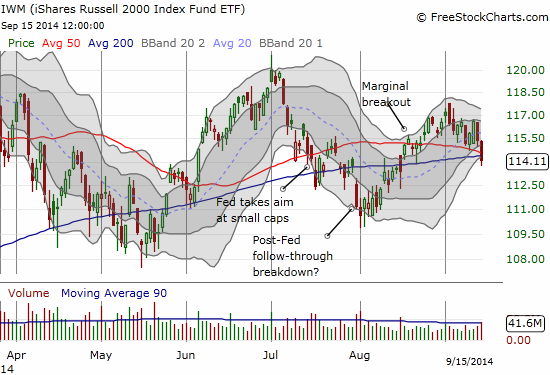
Small caps are right back where the Fed left them…
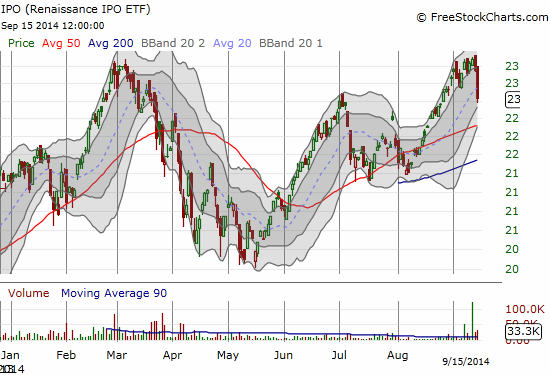
A double-top for Renaissance IPO ETF (IPO)?
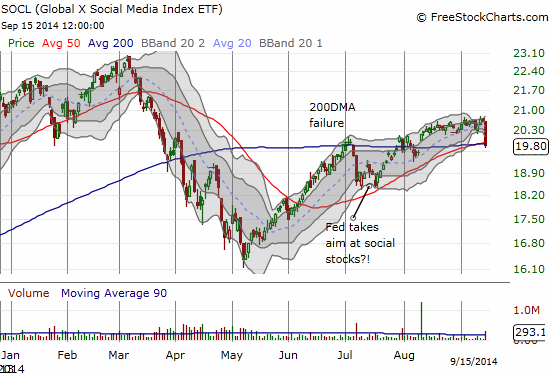
Global X Social Media Index ETF (SOCL) plunges 3.9% for a critical test of converged 50 and 200DMAs
The list of stocks that I saw with massive losses are too much to chart. I wish I could. I just enough time for three down stocks of note, and one upbeat one.
Baidu (BIDU)
If internet stocks sold off because of a desire to move cash into BABA, then BIDU seems like a great choice to play a snapback. BIDU lost 3.3% while Google lost a small fraction of a percent. BIDU cracked its 50DMA and barely closed above support. I speculated ahead of waiting for confirmation with a fresh trade on the stock. The biggest caution is that BIDU made a fresh post-earnings low. One last tranche of buying makes sense if the stock closes the post-earnings gap around $206.
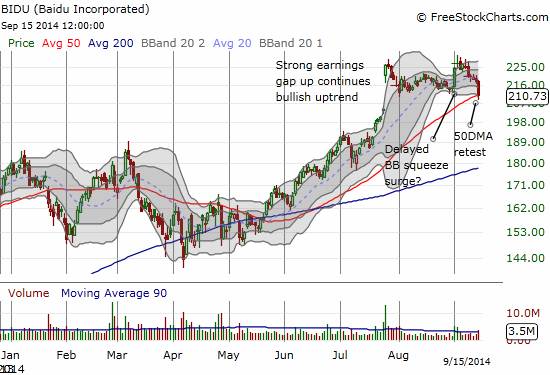
Baidu (BIDU) plunges and barely holds 50DMA support
Twitter (TWTR)
Twitter is bouncing around the critical $50 level again. It is still above the newly formed 200DMA, so technically it is bullish. However, I think the struggles at $50 are bearishly ominous. TWTR is ripe for a fresh sentiment analysis given the impressive recovery from the point where I estimated negative sentiment had become overdone. I also later noted analysts stepping in to finally turn bullish.
Sorry about the mess of words in the chart below, but I want to keep my notes for future reference!
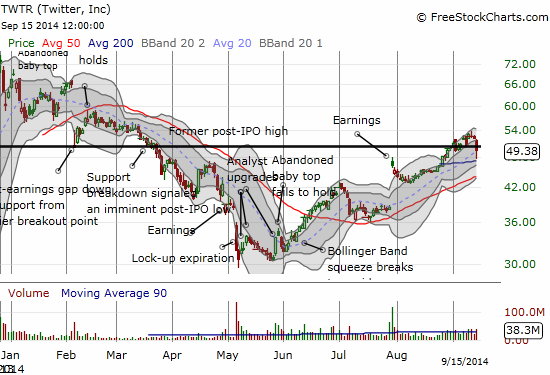
Twitter (TWTR) gyrates around the critical $50 point
Solar City (SCTY)
This triple-top pattern is enough said.
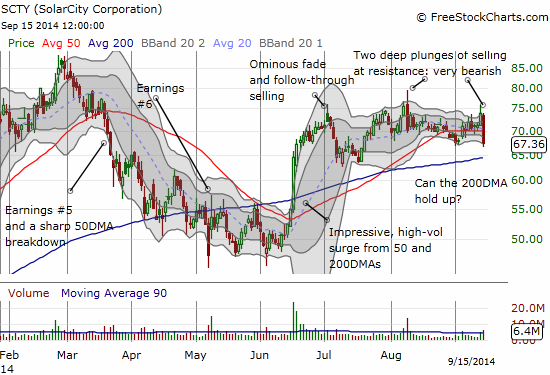
Ominous triple-top kind of action for Solar City (SCTY)
Best Buy (BBY)
Finally, on the positive side, BBY managed to push higher. I am rarely so patient with a stock play anymore. Back in mid-January, I insisted that buying BBY made sense as a contrarian play on a sudden reversal in sentiment that itself seemed so bullishly optimistic in a contrarian way for most of 2013. (A double contrary makes a buy?). I sold a March put that worked out. I also bought what was at the time a long-term (or LEAP) call spread, Jan 27/35 with the assumption that $35 seemed like a good price target. Eight months later, the stock finally lunged at the $35 target, and I sold my position.
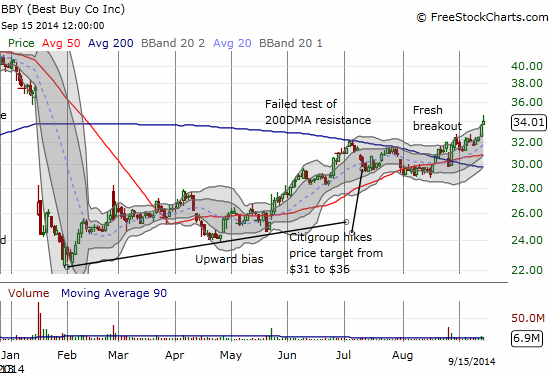
Best Buy (BBY) breaks out as it ever so slowly reverses January’s massive gap down
This is a week to stay on your toes and refresh your price alerts!
Daily T2108 vs the S&P 500

Black line: T2108 (measured on the right); Green line: S&P 500 (for comparative purposes)
Red line: T2108 Overbought (70%); Blue line: T2108 Oversold (20%)
Weekly T2108

Disclosure: Net short Australian dollar, long BIDU call spread, long TWTR calls and puts,


