
T2108 Update – Apple Watch: An Important Fade From All-Time Highs
T2108 Status: 63.3%
T2107 Status: 51.6%
VIX Status: 14.0
General (Short-term) Trading Call: Hold (bullish positions); aggressive bears can short with a tight stop at fresh all-time highs
Active T2108 periods: Day #21 over 20%, Day #19 over 30%, Day #16 over 40%, Day #14 over 50%, Day #9 over 60% (overperiod), Day #91 under 70% (underperiod)
Reference Charts (click for view of last 6 months from Stockcharts.com):
S&P 500 or SPY
SDS (ProShares UltraShort S&P500)
U.S. Dollar Index (volatility index)
EEM (iShares MSCI Emerging Markets)
VIX (volatility index)
VXX (iPath S&P 500 VIX Short-Term Futures ETN)
EWG (iShares MSCI Germany Index Fund)
CAT (Caterpillar).
Commentary
The wait for a resolution between the forces of a bearish divergence and a bullish coiled spring continue even as the S&P 500 (SPY) continues making very marginal closing all-time highs.
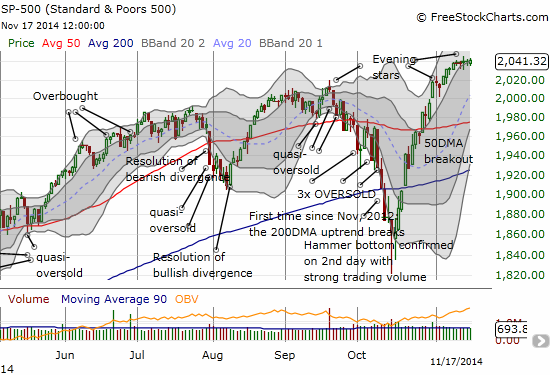
A fifth straight day of essentially going nowhere
T2108 however, is sagging a bit. Today, it slipped slightly again to close at 63.3%. This continues a slight (bearish) divergence from the S&P 500. The volatility index, the VIX, is marginally adding to the bearish interpretation of the divergence as it continues to creep higher during this period; note however that the VIX gapped up and faded today.
This all leaves us in a wait and see mode. Perhaps Apple (AAPL) holds the key to resolution.
Apple’s stock printed an ominous blow-off pattern today with a gain as much as 0.8% when it hit a fresh all-time intraday high of $115.09. If AAPL continues selling off from here, traders should assume a top is firmly in place with a 50DMA retest in play. Such a move would remove an important partner in the bullish interpretation of the market action. Two important caveats: 1) the daily chart seems to have a poor print with the high going over $117 – I used the intraday chart to get the true high; 2) volume was below average and even below some of the recent buying – a blow-off top is much more convincing when volume surges because it more closely signals the potential last gasp of buyers and the exhaustion of buying power.
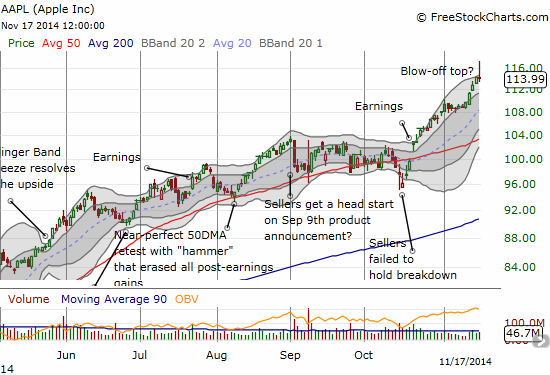
A blow-off top for AAPL?
So now the “Apple Watch” has taken on a new meaning, and I will be watching more vigilantly than ever. The Apple Trading Model (ATM) is projecting 69% odds of upside for Tuesday. Note well though that the ATM does NOT take into consideration chart patterns or highs of the day (just opens and closes).
Here is one big investor/trader who will be VERY relieved to see a top in Apple here:
I am listening to the bullish spin on APPL and I cant share the enthusiasm, sorry Appleheads. $AAPL
— Douglas Kass (@DougKass) October 28, 2013
I am long of Tim Cook and short of Apple. http://t.co/abx3RFCC6b and http://t.co/abx3RFCC6b
— Douglas Kass (@DougKass) October 30, 2014
Daily T2108 vs the S&P 500

Black line: T2108 (measured on the right); Green line: S&P 500 (for comparative purposes)
Red line: T2108 Overbought (70%); Blue line: T2108 Oversold (20%)
Weekly T2108

*All charts created using freestockcharts.com unless otherwise stated
Be careful out there!
Full disclosure: long SSO shares and call options, long AAPL call ...
more

