
2013 Was Good To Joe Sixpack (Relatively) - The Impact Of 2013
One of my favorite responses to those who ask me how things are going is “that I am still alive”. This is the way I feel about the economic events of 2013 as they relate to the average survivor of this year.

One of the issues of any chart I provide is the context or presentation of the data plotted.
Usually, I believe the fairest presentation is year-over-year change with a discussion on the three month trend line of the year-over-year change. I am not sure how people got into their minds that the growth or contraction month-to-month was important when much of the data has these kinds of issues:
- the initially reported data has a high degree of inaccuracy,
- the seasonally adjusted data has methodology issues,
- the reporting month usually is subject to significant revision,
- the new normal data seems to still have a wobble, and analyzing too small of a period can lead you to the wrong conclusion,
- the previous month(s) have been revised – do you compare where you thought you were using last month’s reference point, or use the revised data?
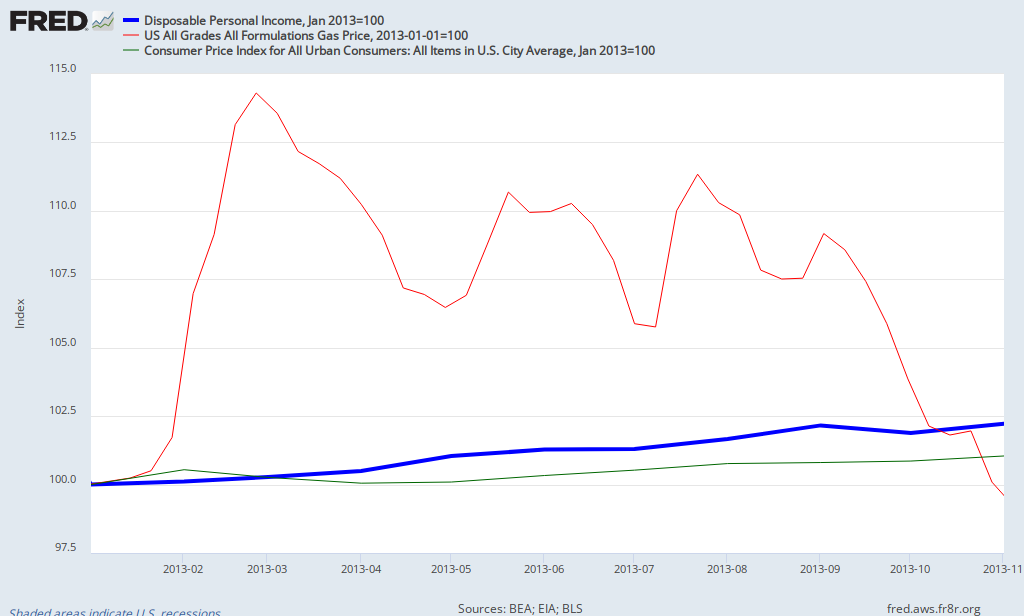
Anyway, I thought it would be interesting to view where the average consumer was at the beginning of the year. For the vast majority of the population, the cost of home ownership or renting changed little this year. But viewing the graph below using the perspective of where we were standing at the beginning of the year, it seems in general most are better off now than they were on New Years 2013.
Indexed to January 2012 – Income (thick blue line), gasoline (red line), and the consumer price index (green line)
The above graph uses data from three different governmental agencies. As a check, the graph below uses only data from the BEA (Bureau of Economic Analysis) which shows that the average consumer has a tiny fraction more money after spending then they did at the beginning of the year.
Index to January 2013 – Real Disposable Personal Income (blue line) to Real Personal Consumption Expenditures (red line)

It is hard to argue that the average consumer is worse off today than they were at the beginning of the year. But my opinion changes when I look into the crystal ball for 2014. The reason is Obamacare. I believe in general there will be a slight to significant income drain for those who have insurance and consider themselves middle class. It is this group of consumers who will be paying the costs for the poorer consumers who will be benefiting from Obamacare.
I have read study after study – many conflicting – about quantifying the effect of Obamacare. Obamacare was intended to be revenue/cost neutral to the government – so every person who benefits will have a person who loses. It is unlikely anyone really knows the real monetary effect on the consumer – and I do not claim to know either. The burden of Obamacare will be on the middle class. And since it is the middle class who drives a consumption based economy, Obamacare is not a positive dynamic for 2014.
Wishing you all a Happy and Prosperous New Year.
Other Economic News this Week:
The Econintersect economic forecast for December 2013 again improved. What this forecast cannot see is the real effect of austerity and Obamacare – but it does see that business is betting the effects on the economy will be minimal.
The ECRI WLI growth index value has been weakly in positive territory for over four months – but in a noticeable improvement trend. The index is indicating the economy six month from today will be slightly better than it is today.
Current ECRI WLI Growth Index

/images/z weekly_indexes.PNG
Initial unemployment claims went from 379,000 (reported last week) to 338,000 this week. Historically, claims exceeding 400,000 per week usually occur when employment gains are less than the workforce growth, resulting in an increasing unemployment rate. The real gauge – the 4 week moving average – degraded from 343,500 (reported last week) to 348,000. Because of the noise (week-to-week movements from abnormal events AND the backward revisions to previous weeks releases), the 4-week average remains the reliable gauge.
Weekly Initial Unemployment Claims – 4 Week Average – Seasonally Adjusted – 2011 (red line), 2012 (green line), 2013 (blue line)

None.


