
Dragonfly Doji – Weekly Market Outlook
 Despite last Monday's decimation and Tuesday's and Wednesday's go-nowhere sessions, a strong Thursday and Friday meant the market managed to make a gain last week. In fact, last week's bar (in its entirety) has many of the tell-tale signs of a bullish reversal. So are these bullish clues telling us our current situation is going to lead to bullishness? Not quite yet – there's one more hurdle to clear before we can safely say the uptrend is "on" again. But, that hurdle is close, and we could have a clear answer as soon as Monday… or maybe Tuesday,
We'll show you what that hurdle is in a moment, right after running down last week's major economic numbers.
Economic Calendar
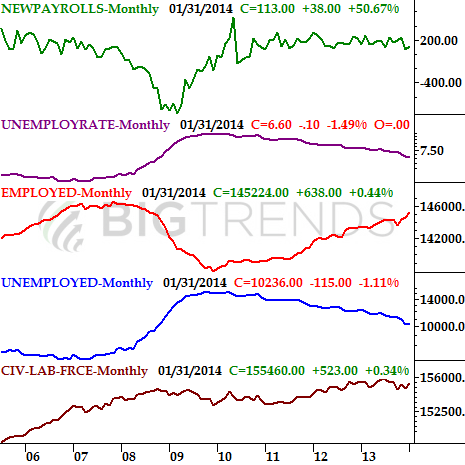
While there was more than a little bit of economic data unveiled last week, let's face it – the unemployment picture was the big story. And, it was…. reasonably good. The unemployment rate fell from 6.7% to 6.6%, and the Department of Labor says 113,000 jobs were created last month. That's better than December's 75,000, but shy of the expected 175,000. And just for the record, it wasn't just some fortunate math that made the unemployment rate sink. More people were employed in January than there were in December, and the number of people who weren't employed as of last month (for any reason) fell between December and January. It's still not great growth, but it's growth all the same, and that's better than a worsening employment situation.
Employment Trend Chart
But what about the ISM Index from Monday? When it rolled in at 51.3 versus expectations of 56.0 (and down from December's reading of 56.5), the market freaked out, sparking a 2.2% selloff. Reality check: The weak ISM number wasn't the reason for Monday's pullback – it was the media's most accessible justification for such a pullback. Truth be told, the market sold off Monday because traders have been itching (even somewhat subconsciously) to sell some stocks and lock in profits for a while. It's just that the perfect storm of psychology and market conditions came together on Monday to spur some serious selling. Had the ISM data been posted in Friday and the employment data posted on Monday, it would have been the employment data that got the blame for the selloff.
In other words, the cause-and-effect the media gives us isn't always an accurate cause-and-effect relationship.
Anyway, everything else is on the following grid.
Economic Calendar
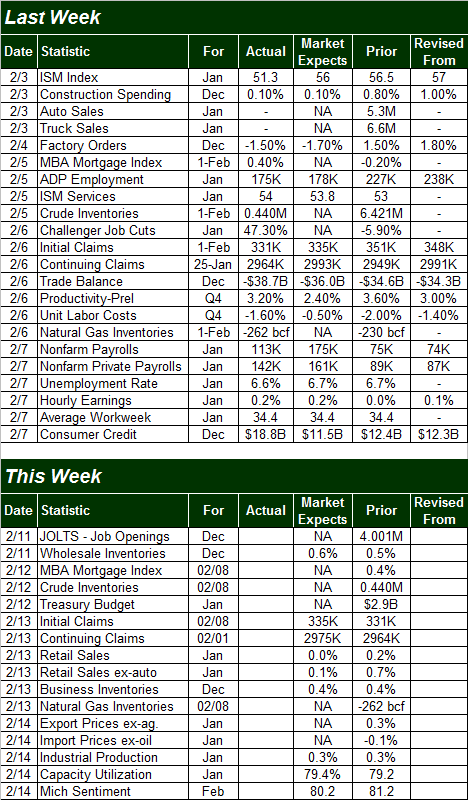
As for the coming week, there's not as much data on the way, and not much of what we're getting is all that important. Thursday's retail sales could be a market mover, especially with modest growth; the pros are basically looking for no change there. The most important data in the queue is Friday's industrial productivity and capacity utilization numbers. Although the market doesn't seem to care much about this information, it's actually pretty important to the long-term market trend. Either way, economists are looking for modest increases from both sets of data. As long as the data doesn't come up short, good news here may be a much-needed prop for stocks is the recovery gets wobbly this week.
Stock Market Index Analysis
Yes, it ended up being a good week for the market, with the rally late in the week more than offsetting Monday's drubbing. It's a bit too soon to assume the long-term rally is back in play, though it's not too soon to start thinking about the possibility.
Let's start to make the bullish case with the weekly chart of the S&P 500 (SPX) (SPY) … since that's where the bullish argument is strongest.
Ever heard of a dragonfly doji? It's a certain-shaped bar (on a chart) that usually indicates a significant reversal effort. The 'doji' part of the name means the open and close – the weekly open and the weekly close, in this case – are right at the same level. Last week, the S&P 500 opened at 1782.68, and closed at 1797.02…. about the same. The 'dragonfly' part of the name (and it's also called a 'hammer' in some cases) refers to the apparent shape of that bar. Yes, last week's bar for the S&P 500 on the chart below looks – loosely – like a dragonfly, with short wings at the top of the body and a long tail at the bottom. The shape of the pattern suggests a transition from a strong selling trend to a strong buying trend. Yeah, well, the S&P 500 made a dragonfly doji last week, hinting that the selling could be over, and the buying could have resumed.
S&P 500 & VIX – Weekly Chart
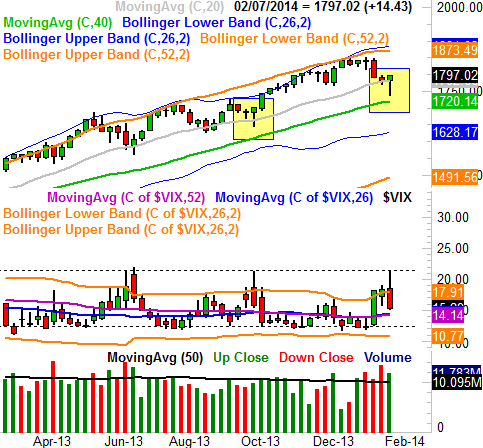
There's another reason it wouldn't be crazy to start thinking bullishly here – the CBOE Volatility Index (VIX) (VXX) merely had to brush a known resistance line at 21.40 to begin pulling back, allowing the S&P 500 to rekindle its rally. In fact, the last time the VIX rolled over at 21.40 back in October, we also saw the S&P 500 also made a dragonfly doji. That doji along with last week's doji are highlighted on the chart. As you can see, the October doji did end up starting a nice runup. That's why we have to at least respect the possibility of mire bullishness now. There's just one challenge to that possibility…. the daily chart still has a major hurdle in front of it.
That hurdle is 1809. As strong as things were late last week, the S&P 500 hasn't actually made any real technical progress. There's a major ceiling around 1809, where a couple of key moving averages have intercepted, and where the S&P 500 hit a ceiling several times in December. It would be unwise to assume that level couldn't be a resistance level now.
S&P 500 & VIX – Daily Chart
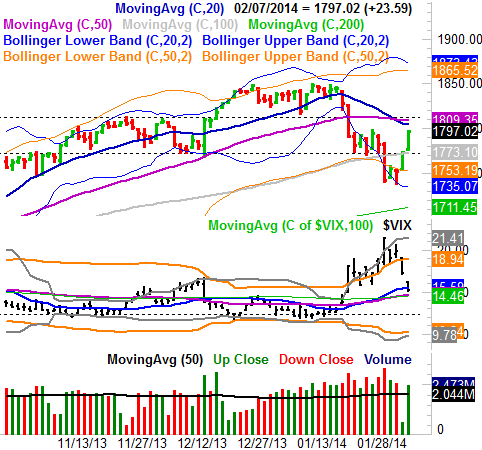
The bulls will argue that the current momentum is bullish, and there's not much that can stop this moving freight train now. The problem is, the speed and size of Thursday's and Friday's gain is the very thing that could put the kibosh and the rally. Between the S&P 500's bullish gap and the VIX's downward gap on Friday, there's a lot of pressure to fill in those gaps now. One misstep on Monday could pop this bubble before it gets a chance to really inflate. Almost needless to say, things could get real interesting real quick this week.
Trade Well.
None.


