
Large Cap Report
Methodology
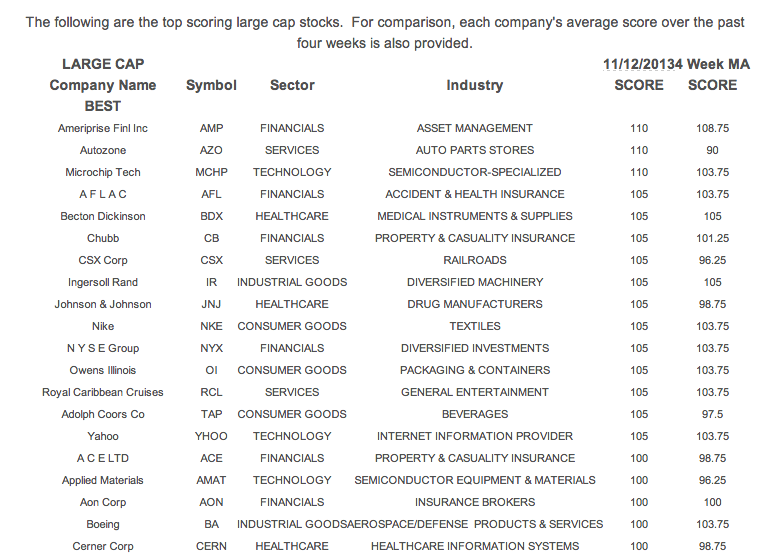
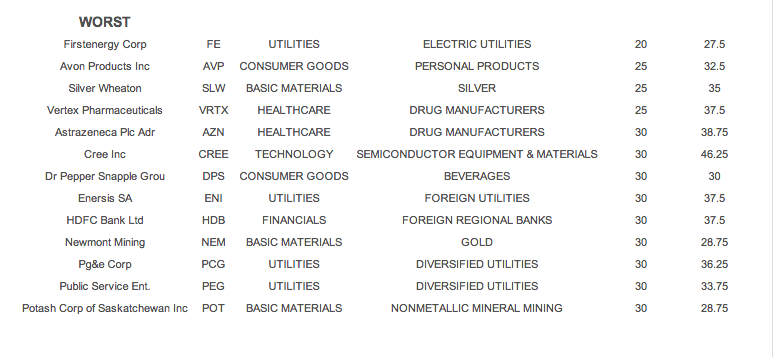
Our weekly best and worst reports show you stocks with the best potential returns over the coming 6 to 12 months. The score is calculated by fusing together the key drivers of price movement including, earnings beats, earnings growth, at-the-market insider buys, institutional activity, short ratio analysis, price to earnings analysis and calendar quarter seasonality. Those stocks appearing in our best list should be bought while those appearing in our worst list should be sold.
- The best large cap sector is industrial goods.
- The top large cap industry is diversified machinery.
The average score across large cap is 72.39, below the 4 week moving average score of 73.60. The typical large cap stock is trading 6.16% above its 200 day moving average, has 4.30 days to cover short and is expected to see EPS growth of 11.42% next year.
The best sectors in large cap are industrial goods, services, financials and healthcare. Consumer goods score in line. Technology, basics and utilities score below average.

 |
Commentary:
The following chart shows the historical average score across large cap, by sector.


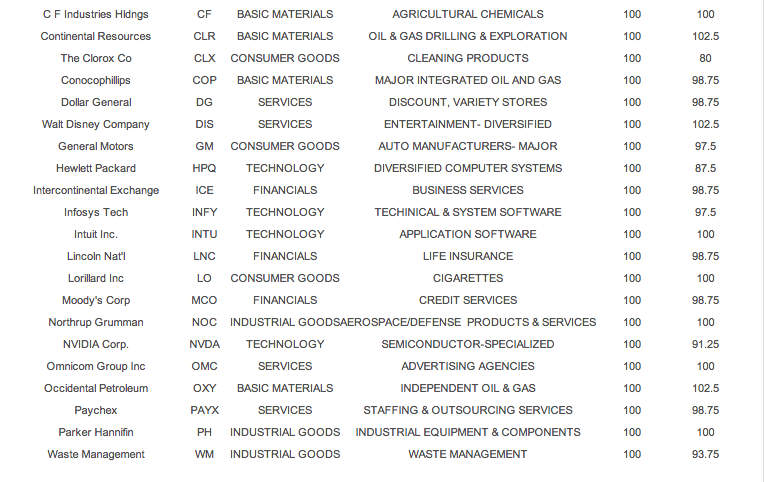
The best scoring large cap industry is diversified machinery (IR, FLS, DOV, CMI). Auto parts (LEA, JCI, MGA) offer upside on higher production. Insurance brokers (AON, MMC, WSH) benefit from rising demand tied to employment growth and pricing power. Aerospace/defense (NOC, BA, RTN, HON) benefits from rising OEM production rates and assumptions defense spending will stabilize in budget negotiations. Business software (WIT, FISV, CTSH, ADP, DOX) enjoys positive seasonality tied to expectations for rising IT spending in 2014, including a slight increase in Government IT spending.
In large cap basic materials, buy industrial metals & minerals (BTU, ANR, ATI), major chemicals (DOW, APD) and oil & gas drilling & exploration (CLR, NBR, RIG, ESV). In consumer goods, focus on auto parts, major food (ADM) and textiles (NKE, VFC). Across financials, the top scoring industries are insurance brokers, credit services (MCO, SLM, COF, DFS) and asset managers (AMP, TROW, PFG, BLK). The best healthcare industries are healthcare plans (CI, WLP, HUM, AET), biotechnology (CELG, GILD, LIFE) and medical instruments & supplies (BDX, SYK BCR). The top industrial goods industries are diversified machinery, aerospace/defense and industrial equipment & components (PH, EMR). In services, buy diversified entertainment (DIS, TWX, VIA), railroads (CSX, NSC, CP) and lodging (H, HOT, MAR). The best technology baskets are business software, diversified computer systems (HPQ, IBM) and technical & system software (INFY, ADSK).
| LG CAP INDUSTRY SCORE BY SECTOR | 11/12/2013 | |
| Sector | Industry | SCORE |
| BASIC MATERIALS | INDUSTRIAL METALS & MINERALS | 82.00 |
| BASIC MATERIALS | CHEMICALS- MAJOR DIVERSIFIED | 81.67 |
| BASIC MATERIALS | OIL & GAS DRILLING & EXPLORATION | 76.43 |
| BASIC MATERIALS | MAJOR INTEGRATED OIL AND GAS | 76.25 |
| BASIC MATERIALS | OIL & GAS REFINING & MARKETING | 75.00 |
| BASIC MATERIALS | AGRICULTURAL CHEMICALS | 73.00 |
| BASIC MATERIALS | OIL & GAS EQUIPMENT & SERVICES | 72.50 |
| BASIC MATERIALS | STEEL & IRON | 72.22 |
| BASIC MATERIALS | INDEPENDENT OIL & GAS | 69.12 |
| BASIC MATERIALS | OIL & GAS PIPELINES | 55.00 |
| BASIC MATERIALS | GOLD | 45.00 |
| CONSUMER GOODS | AUTO PARTS | 93.33 |
| CONSUMER GOODS | FOOD - MAJOR DIVERSIFIED | 77.50 |
| CONSUMER GOODS | TEXTILES | 77.50 |
| CONSUMER GOODS | CIGARETTES | 75.00 |
| CONSUMER GOODS | AUTO MANUFACTURERS- MAJOR | 67.50 |
| CONSUMER GOODS | PERSONAL PRODUCTS | 67.00 |
| CONSUMER GOODS | BEVERAGES | 66.43 |
| CONSUMER GOODS | PROCESSED & PACKAGED GOODS | 61.43 |
| FINANCIALS | INSURANCE BROKERS | 91.67 |
| FINANCIALS | CREDIT SERVICES | 89.00 |
| FINANCIALS | ASSET MANAGEMENT | 86.67 |
| FINANCIALS | LIFE INSURANCE | 83.33 |
| FINANCIALS | PROPERTY & CASUALITY INSURANCE | 79.09 |
| FINANCIALS | MONEY CENTER BANKS | 78.33 |
| FINANCIALS | INVESTMENT BROKERAGE | 71.25 |
| FINANCIALS | REGIONAL BANKS | 70.56 |
| FINANCIALS | SAVINGS & LOANS | 66.67 |
| FINANCIALS | REITS | 56.54 |
| FINANCIALS | FOREIGN MONEY CENTER BANKS | 54.00 |
| HEALTHCARE | HEALTH CARE PLANS | 85.00 |
| HEALTHCARE | BIOTECHNOLOGY | 76.00 |
| HEALTHCARE | MEDICAL INSTRUMENTS & SUPPLIES | 76.00 |
| HEALTHCARE | MEDICAL APPLIANCES & EQUIPMENT | 71.43 |
| HEALTHCARE | DRUG MANUFACTURERS | 64.00 |
| INDUSTRIAL GOODS | DIVERSIFIED MACHINERY | 94.17 |
| INDUSTRIAL GOODS | AEROSPACE/DEFENSE PRODUCTS & SERVICES | 90.00 |
| INDUSTRIAL GOODS | INDUSTRIAL EQUIPMENT & COMPONENTS | 86.67 |
| INDUSTRIAL GOODS | FARM & CONSTRUCTION MACHINERY | 71.25 |
| SERVICES | ENTERTAINMENT- DIVERSIFIED | 88.75 |
| SERVICES | RAILROADS | 88.75 |
| SERVICES | LODGING | 88.33 |
| SERVICES | DRUGS WHOLESALE | 83.33 |
| SERVICES | BUSINESS SERVICES | 82.50 |
| SERVICES | GROCERY STORES | 81.67 |
| SERVICES | DISCOUNT, VARIETY STORES | 80.00 |
| SERVICES | DRUG STORES | 80.00 |
| SERVICES | RESORTS AND CASINOS | 76.67 |
| SERVICES | APPAREL STORES | 69.17 |
| SERVICES | AIR DELIVERY & FREIGHT SERVICES | 68.75 |
| SERVICES | RESTAURANTS | 68.75 |
| SERVICES | CATV SYSTEMS | 62.50 |
| SERVICES | DEPARTMENT STORES | 57.00 |
| TECHNOLOGY | BUSINESS SOFTWARE & SERVICES | 90.00 |
| TECHNOLOGY | DIVERSIFIED COMPUTER SYSTEMS | 85.00 |
| TECHNOLOGY | TECHINICAL & SYSTEM SOFTWARE | 85.00 |
| TECHNOLOGY | DATA STORAGE DEVICES | 80.00 |
| TECHNOLOGY | SEMICONDUCTOR EQUIPMENT & MATERIALS | 75.00 |
| TECHNOLOGY | SEMICONDUCTOR-SPECIALIZED | 75.00 |
| TECHNOLOGY | APPLICATION SOFTWARE | 74.38 |
| TECHNOLOGY | INTERNET INFORMATION PROVIDER | 74.00 |
| TECHNOLOGY | SCIENTIFIC & TECHNICAL INSTRUMENTS | 73.33 |
| TECHNOLOGY | COMMUNICATION EQUIPMENT | 62.86 |
| TECHNOLOGY | SEMICONDUCTOR- BROAD LINE | 62.00 |
| TECHNOLOGY | INTERNET SOFTWARE & SERVICES | 60.83 |
| TECHNOLOGY | WIRELESS COMMUNICATIONS | 60.56 |
| TECHNOLOGY | SEMICONDUCTOR- INTEGRATED CIRCUITS | 60.00 |
| TECHNOLOGY | TELECOM SERVICES - DOMESTIC | 60.00 |
| TECHNOLOGY | DIVERSIFIED COMMUNICATION SERVICES | 50.00 |
| UTILITIES | ELECTRIC UTILITIES | 57.14 |
| UTILITIES | DIVERSIFIED UTILITIES | 52.86 |
| UTILITIES | FOREIGN UTILITIES | 40.00 |


