
Sector Rankings For ETFs & Mutual Funds
For the second quarter of 2014, only three sectors manage to even earn a Neutral rating. My sector ratings are based on the aggregation of my fund ratings for every ETF and mutual fund in each sector.
Investors looking for sector funds that hold quality stocks should look no further than the Consumer Staples or Financials sector. Only these sectors house Attractive-or-better rated funds. Figures 6 and 7 provide details. The primary driver behind an Attractive fund rating is good portfolio management, or good stock picking, with low total annual costs
Note that the Attractive-or-better Predictive ratings do not always correlate with Attractive-or-better total annual costs. This fact underscores that (1) low fees can dupe investors and (2) investors should invest only in funds with good stocks and low fees.
See Figures 4 through 13 for a detailed breakdown of ratings distributions by sector. See my ETF & mutual fund screener for rankings, ratings and free reports on 7000+ mutual funds and 400+ ETFs. My fund rating methodology is detailed here.
All of my reports on the best & worst ETFs and mutual funds in every sector and investment style are available here.
Figure 1: Ratings For All Sectors
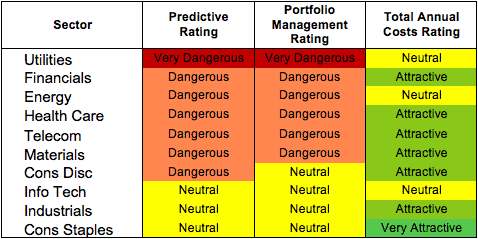
Source: New Constructs, LLC and company filings
To earn an Attractive-or-better Predictive Rating, an ETF or mutual fund must have high-quality holdings and low costs. Only five sector ETFs and mutual funds meet these requirements, which is only 0.6% of all sector ETFs and mutual funds.
Fidelity MSCI Consumer Staples Index ETF (FSTA) is my top Consumer Staples ETF. It earns my Attractive rating by allocating over 40% of its value to Attractive-or-better-rated stocks.
Wal-Mart Stores, Inc. is one of my favorite stocks held by FSTA. WMT earns my Attractive rating. WMT has grown its economic earnings by 9% compounded annually over the past decade. The retailer has earned a double-digit return on invested capital (ROIC) in every year of our model going back to 1998. Usually one has to pay a premium for a blue chip stock like WMT, but it’s currently very undervalued. At its current valuation of ~$76/share, WMT has a market-implied growth appreciation period (GAP) of less than one year. A more reasonable GAP for a Consumer Staples company would be between 15 and 20 years. If we give WMT credit for 15 years of profit (NOPAT) growth at a long-term rate of 6%, the stock has a fair value of over $150/share today.
Rydex Series Funds: Utilities Fund (RYUTX) is my worst Utilities mutual fund. It gets my Very Dangerous rating by allocating over 93% of its value to Neutral-or-worse-rated stocks, and to make matters worse, charges investors total annual costs of 4.79%.
Dominion Resources, Inc. (D) is one of my least favorite stocks held by RYUTX. D gets my Very Dangerous rating. Over the past decade, D has grown NOPAT by only 2% compounded annually, while return on invested capital (ROIC) has remained stagnant at 4%. However D’s current valuation of ~$70/share implies the market expects the company to grow NOPAT by 7% compounded annually for 17 years. 7% profit growth for even one year is a remarkable feat for a utility. It’s not feasible to predict that D can grow by that much for nearly two decades.
Figure 2 shows the distribution of our Predictive Ratings for all sector ETFs and mutual funds.
Figure 2: Distribution of ETFs & Mutual Funds (Assets and Count) by Predictive Rating
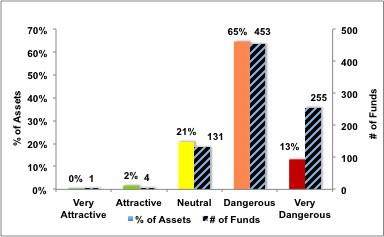
Source: New Constructs, LLC and company filings
Figure 3 offers additional details on the quality of the sector funds. Note that the average Total Annual Cost of Very Dangerous funds is almost 13 times that of Attractive funds.
Figure 3: Predictive Rating Distribution Stats
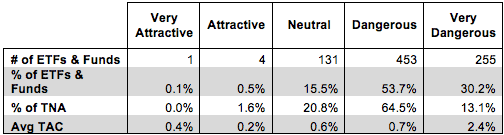
* Avg TAC = Weighted Average Total Annual Costs
Source: New Constructs, LLC and company filings
This table shows that only the best of the best funds get our Very Attractive Rating: they must hold good stocks AND have low costs. Investors deserve to have the best of both and we are here to give it to them.
Ratings by Sector
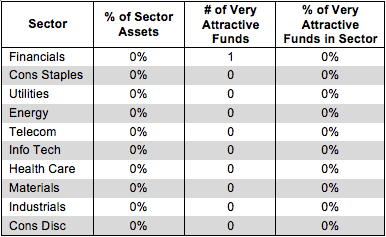
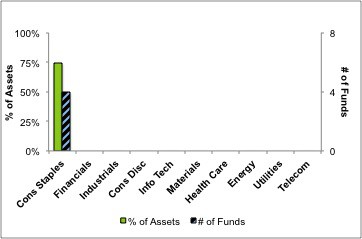
Figure 4 presents a mapping of Very Attractive funds by sector. The chart shows the number of Very Attractive funds in each sector and the percentage of assets in each sector allocated to funds that are rated Very Attractive.
Only one sector fund, PowerShares KBW Property & Casualty Insurance Portfolio (KBWP) earns my Very Attractive rating.
Figure 4: Very Attractive ETFs & Mutual Funds by Sector
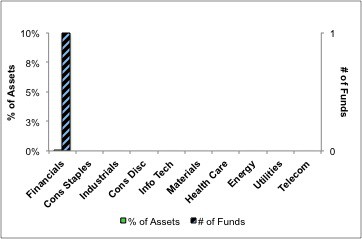
Source: New Constructs, LLC and company filings
Figure 5 presents the data charted in Figure 4
Figure 5: Very Attractive ETFs & Mutual Funds by Sector
Source: New Constructs, LLC and company filings
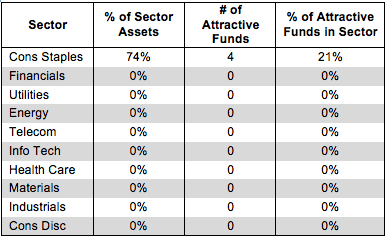
Figure 6 presents a mapping of Attractive funds by sector. The chart shows the number of Attractive funds in each sector and the percentage of assets allocated to Attractive-rated funds in each sector.
Note that the Consumer Staples sector is the only sector that houses Attractive-rated funds. Almost 75% of investor assets in the Consumer Staples sector are in Attractive-rated funds. Investors are putting their money in the right places when it comes to Consumer Staples funds.
Figure 6: Attractive ETFs & Mutual Funds by Sector
Source: New Constructs, LLC and company filings
Figure 7 presents the data charted in Figure 6.
Figure 7: Attractive ETFs & Mutual Funds by Sector
Source: New Constructs, LLC and company filings
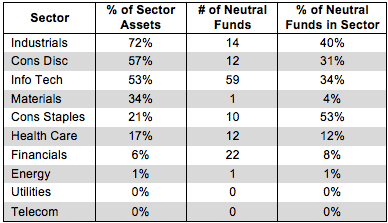
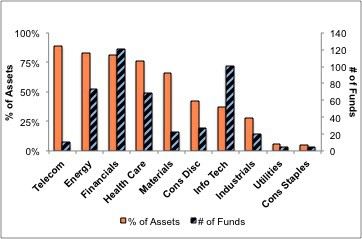
Figure 8 presents a mapping of Neutral funds by sector. The chart shows the number of Neutral funds in each sector and the percentage of assets allocated to Neutral-rated funds in each sector.
Figure 8: Neutral ETFs & Mutual Funds by Sector
Source: New Constructs, LLC and company filings
Figure 9 presents the data charted in Figure 8.
Figure 9: Neutral ETFs & Mutual Funds by Sector
Source: New Constructs, LLC and company filings
Figure 10 presents a mapping of Dangerous funds by fund sector. The chart shows the number of Dangerous funds in each sector and the percentage of assets allocated to Dangerous-rated funds in each sector.
Note that even the highest rated sectors have some Dangerous funds. Even in a good sector, investors have to beware of the bad funds. To avoid owning a fund that blows up, you have to do your diligence.
Figure 10: Dangerous ETFs & Mutual Funds by Sector
Source: New Constructs, LLC and company filings
Figure 11 presents the data charted in Figure 10.
Figure 11: Dangerous ETFs & Mutual Funds by Sector
Source: New Constructs, LLC and company filings
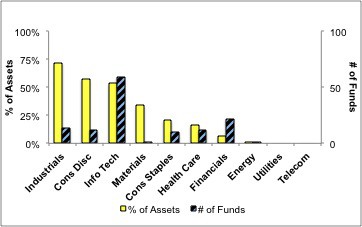
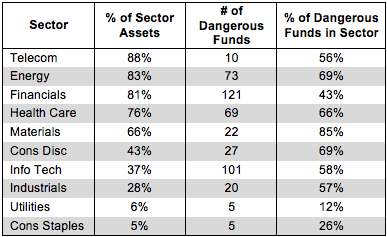
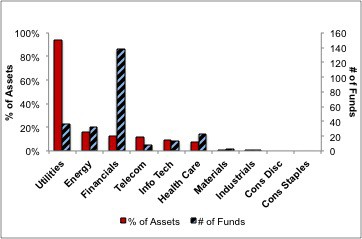
Figure 12 presents a mapping of Very Dangerous funds by fund sector. The chart shows the number of Very Dangerous funds in each sector and the percentage of assets in each sector allocated to funds that are rated Very Dangerous.
There are almost 140 Very Dangerous rated Financials ETFs and mutual funds. These funds exist only to make money for the managers and the fund company, not for investors. Fund providers put out these low-quality, high-fee funds and rake in the cash from those naïve enough to buy in. Investors don’t need 140 Financial funds, and they certainly don’t need 140 Very Dangerous ones.
Figure 12: Very Dangerous ETFs & Mutual Funds by Sector
Source: New Constructs, LLC and company filings
Figure 13 presents the data charted in Figure 12.
Figure 13: Very Dangerous ETFs & Mutual Funds by Sector
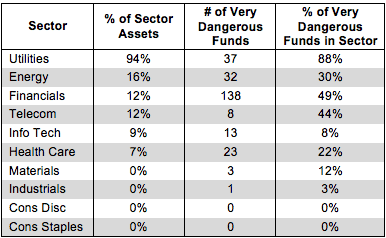
Source: New Constructs, LLC and company filings
David Trainer and Kyle Guske II receive no compensation to write about any specific stock, sector, or theme.


