
Weekly Market Outlook - The Battle Lines Have Been Drawn, And Verified
The bulls tried to put a second consecutive weekly win in the books, but it just wasn't meant to be. In fact, the modest bullish bounce that started to take shape on Friday faded just a bit before the closing bell rang. That lull wasn't a devastating blow, but some of the indices are once again testing key support lines. Those floors may or may not survive another test.
We'll explore the market's current still-on-the-fence condition below. First though, let's run through last week's biggest economic news, and preview what's scheduled for this week. Spoiler alert: Inflation is even worse than we feared as a of a week ago.
Economic Data Analysis
What a week! There's plenty to sift through, so let's just dig in, in order of appearance.
That party started on Tuesday with a look at last month's producer inflation rate to round out the previous week's consumer inflation figures. Like that report, inflation for the country's factories and production plants is just as painful. Overall input prices grew 9.6% year over year, but even stripping out the volatile costs of food and fuel, prices still grew 6.9%. Both are records, and bolster the case for interest rate increases that will curb this price growth.
Inflation Rate Charts
(Click on image to enlarge)
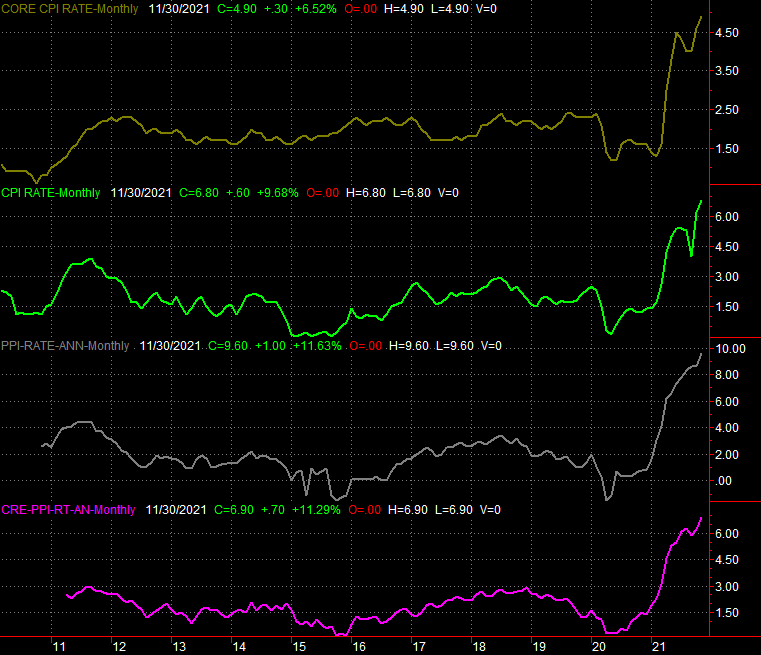
Source: Bureau of Labor Statistics, TradeStation
The Federal Reserve didn't do that, though... at least not yet. The target Fed funds rate remains between 0.0% and 0.25% (or 0.13%), with the FOMC opting to not alter it last week when it had a chance to do so. The Fed's governors did decide to accelerate the pace of bond buying though, which has a similar effect.
Also on Wednesday we heard about last month's retail spending. It was good, even if not great. And, it arguably would have been great were it not compared to such great numbers seen in October. Even so, every stratification of consumer spending hit records in November. Note that at least some of this growth can be attributed to price increases. Still, consumers are doing their part, undeterred by higher prices.
Retail Sales Charts
(Click on image to enlarge)
Source: Census Bureau, TradeStation
The same goes for the nation's factories making the goods and products those consumers are buying. Industrial production ratcheted up by 0.5% last month, according to the Fed's report on the matter posted Thursday, pushing this activity to levels that are above what they were the month before COVID-19 arrived in the U.S. Similarly, utilization of the country's manufacturing capacity grew 0.4%, to get near its level seen right before the March-2020 implosion. Regardless of their current levels, the upward trajectory is the key here... and bullish, at least for the long-term.
Industrial Productivity And Capacity Utilization Charts
(Click on image to enlarge)
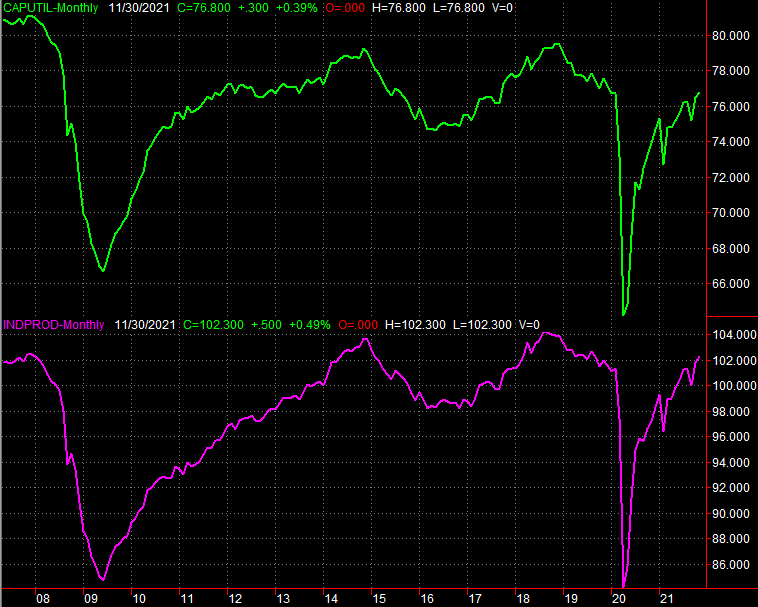
Source: Federal Reserve, TradeStation
Finally, on Thursday we got November's housing starts and building permits reports. There were good, and far better than anticipated. It's still too soon to say either is back on the same growth track they were on before the volatile swings seen in the wake of the pandemic. As it stands right now though, at least we're seeing this data back away from what was nearing the beginning of a new downtrend.
Housing Starts And Building Permits Charts
(Click on image to enlarge)

Source: Census Bureau, TradeStation
Everything else is on the grid.
Economic Calendar
(Click on image to enlarge)
Source: Briefing.com
This week won't be quite as busy, but there are some biggies in the queue.
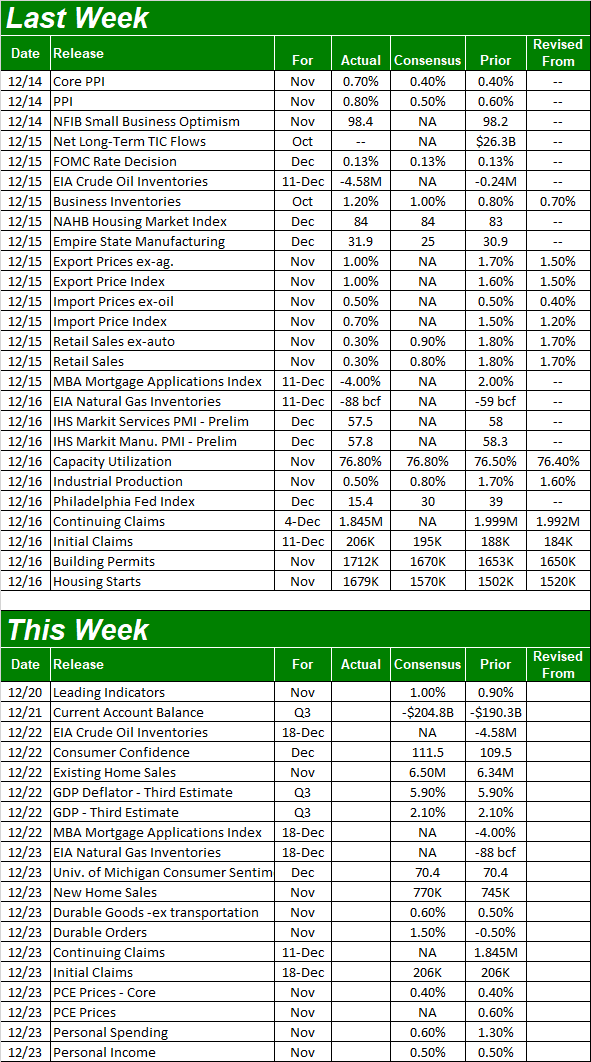
It's a particularly big week for sentiment measures. The Conference Board's consumer confidence score for December will be posted on Wednesday, and the third and final look at the University of Michigan Sentiment Index is due on Thursday. Both are expected to be much-needed improvements on November's horrible numbers, although that improvement will still leave both well below peaks hit earlier this year.
Consumer Confidence Charts
(Click on image to enlarge)
Source: Conference Board, University of Michigan, TradeStation
We'll also get the third and final estimate of Q3's GDP growth rate on Wednesday, though economists don't expect anything to have changed from the second guess of 5.9%.
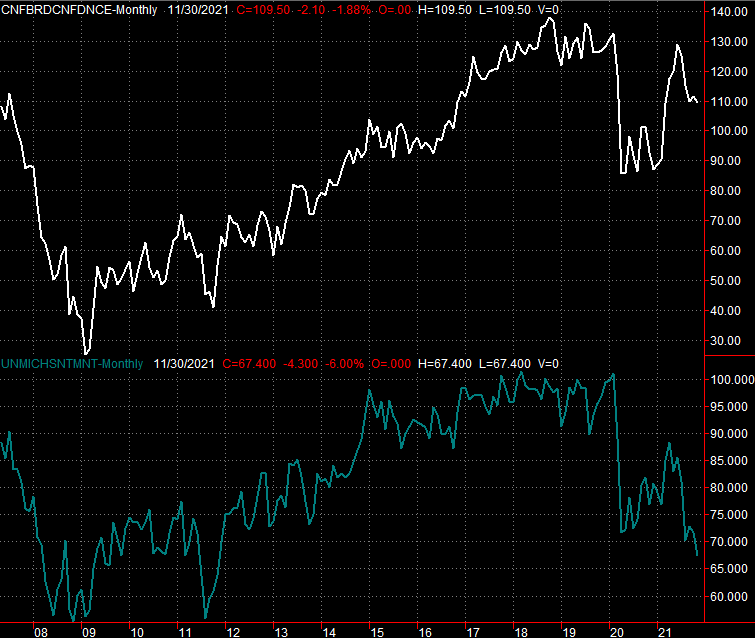
Finally, look for November's new home sales on Wednesday as well. Economists are calling for a modest improvement, but that improvement would still leave the figure at the lower end of its recent range.
Home Sales Charts
(Click on image to enlarge)
Source: Conference Board, University of Michigan, TradeStation
The existing home sales report for last month won't be posted until next week. It doesn't need as much help.
Stock Market Index Analysis
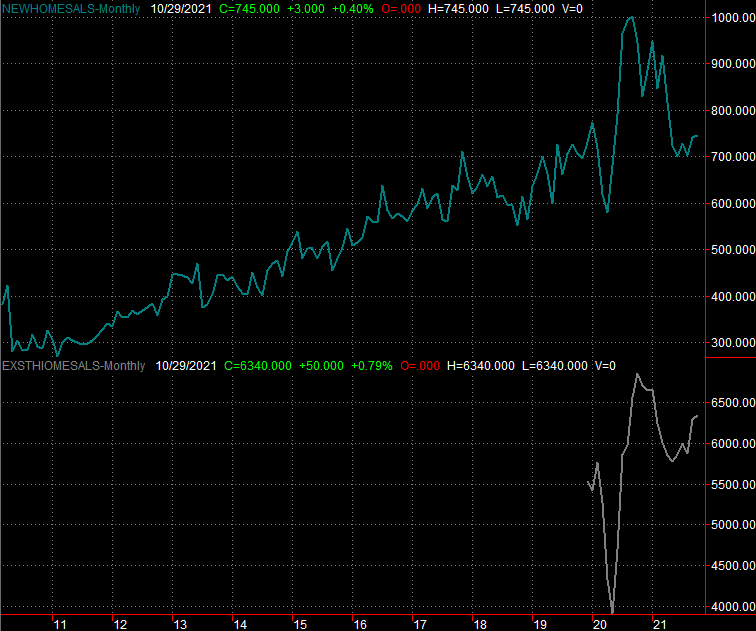
We're kicking this week off with a look at the weekly chart of the NASDAQ Composite, as that's the most telling of what's actually happening right now. Take a look. The NASDAQ opened below last week's close, and closed below last week's open, and reversed course... from bullish to bearish. It's close to be an "inside day" reversal, although in this case the bar in question is a full week rather than one day. Regardless, it's a shape that often signals a reversal. A reversal of what, however, is the question. As you can see, the NASDAQ Composite is also being squeezed into a narrow trading range (red, dashed) within the past three weeks, within a longer-term, rising trading range (orange, solid). Traders can't decide which direction to go, and that indecision is only growing.
NASDAQ Composite Weekly Chart, With VXN
Source: TradeNavigator
Zooming into the daily chart of the composite gives us a little more detail. Namely, in this timeframe we can see the NASDAQ is once again dancing with support at its 100-day moving average (gray). The daily chart is also a better reminder that the NASDAQ remains within sight and striking distance of the lower boundary of its longer-term trading range.
NASDAQ Composite Daily Chart, With VXN
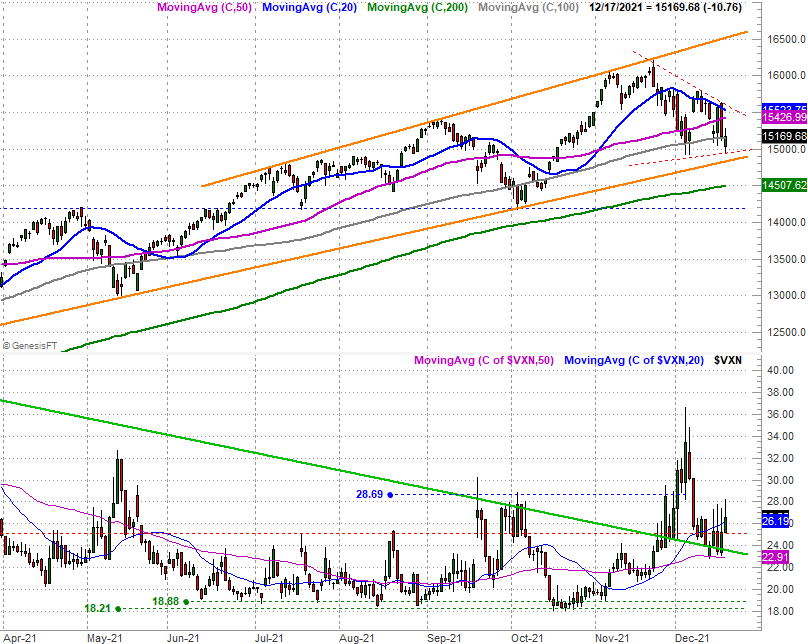
Source: TradeNavigator
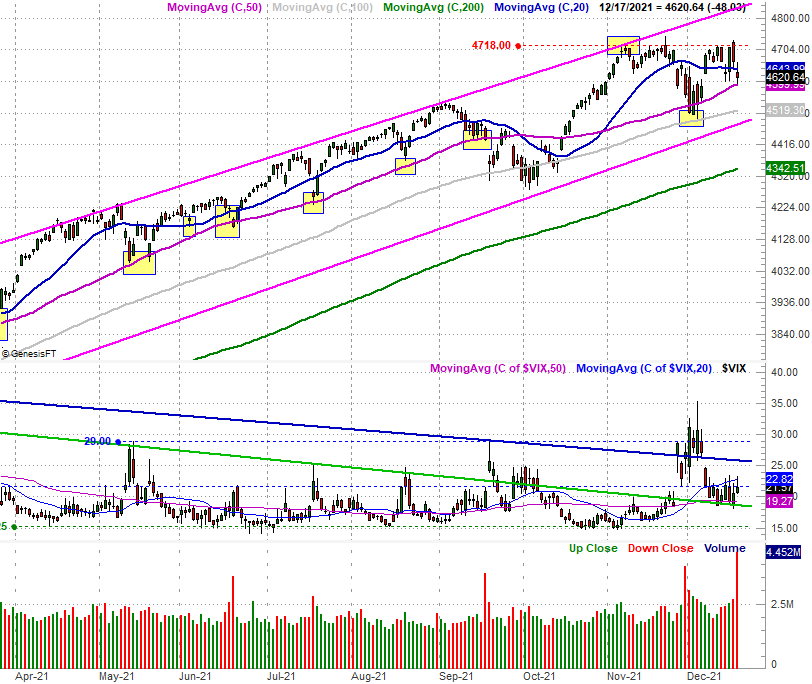
The S&P 500's chart looks similar, though not identical. The index's rebound effort from last week was halted after bumping into a technical ceiling near 4724 (blue, dashed). But, that doesn't necessarily put the bullish effort from two weeks ago in jeopardy. The S&P 500 is still holding above its 50-day (purple) moving average line.
S&P 500 Weekly Chart, With VIX And Volume
(Click on image to enlarge)
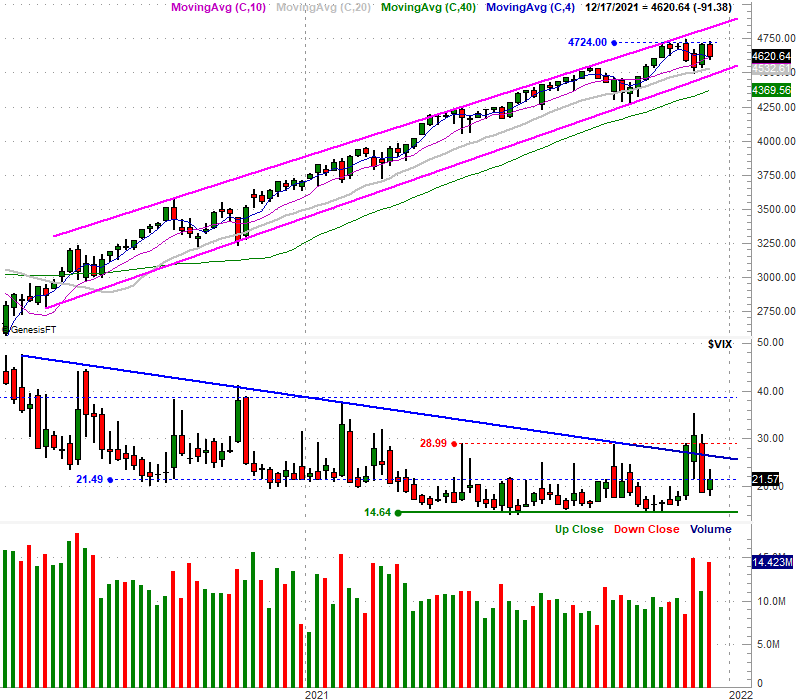
Source: TradeNavigator
That's more readily evident on the daily chart. Also readily evident on the daily chart is that the S&P 500's Volatility Index (VIX) is unable to push its way above its 20-day moving average line (blue) at 22.8. It's going to need to clear that hurdle before the bears can start to do any real damage to the market itself.
S&P 500 Daily Chart, With VIX And Volume
(Click on image to enlarge)
Source: TradeNavigator
Don't try to see something in all of this that just isn't there. The market's stuck in neutral here, trapped between well-defined floors and ceilings. The good news is, the lines in the sand are well-defined.
By the way, Friday's volume surge isn't especially significant. It was an options expiration day, for the month as well as the quarter, in addition to being the last one of the year. A lot of activity was to be expected.
Disclaimer: Riki nema disclaimer.


