
Burning The Fuel Of Economic Growth
Last week when the relatively soft consumer credit data was released by the Fed, I recalled a rather humorous post in Forbes Credit Gets You a TV, Not Economic Growth which concluded ....

Maybe credit really does drive growth. Maybe excess credit really does force a boom to turn into a bust. But no one has yet come up with a really compelling, testable explanation for how that happens. And no one -- except maybe Dalio -- has managed to use credit levels, credit-growth levels, acceleration of the ratio of credit-to-gross domestic product, or any such measure to predict when booms and busts will happen.
So this thing that almost everyone believes about the economy is really just a conjecture. Our faith in it is probably based in part on shaky analogies and bad intuition. It might be true, but we shouldn’t regard it as obvious.
I do a rather vigorous review of consumer credit monthly because:
- I distrust the annualized and seasonally adjusted headline data the mass media scoops up, regurgitates, and spits out.
- I am uncertain of the relationship of credit to the economy. Is it a chicken or egg or just simple correlation?
- Going through a vigorous review monthly forces me to rethink this relationship every month. I hope that eventually I will have an "ah ha" moment.
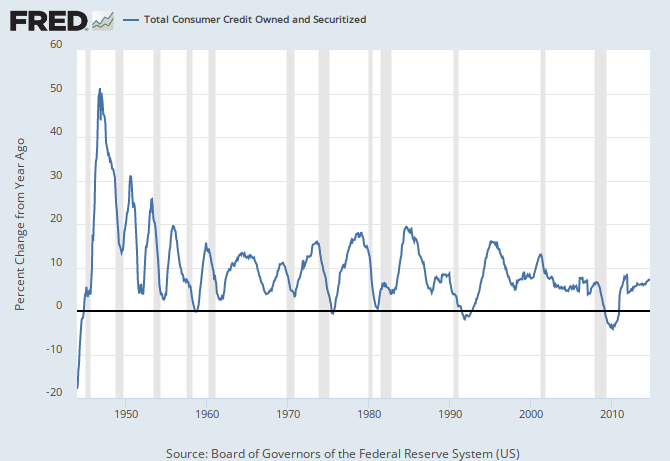
Historically, consumer credit year-over-year growth USUALLY (but not always) peaks prior to a recession, and USUALLY (but not always) is declining going into a recession. So there is a general correlation to business cycles. The problem in using this data as a tool is:
- the Fed consumer credit data is far from accurate when first released;
- it lags real time by one month;
- just because consumer credit softens, it does not necessarily foretell a recession is coming;
- and trends come and disappear each month due to the backward revision.
Also there is little question that consumer credit is becoming a larger and larger element in the economy - but:
- prior to 1980 it seems there was a positive correlation between consumer credit to gdp ratio and GDP growth;
- since 1980, consumer credit to gdp ratio has had an inverse correlation to GDP growth.
Could it be true that at some point of growth, consumer credit growth works against GDP growth?

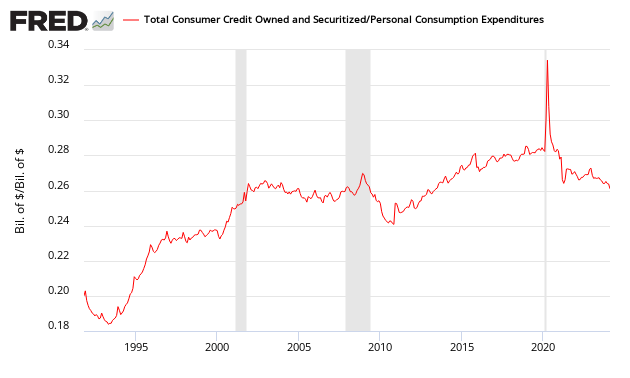
As I stated earlier, September consumer credit was soft. There is now a three month trend in play of a declining rate of growth. The graph below shows the ratio of consumer credit outstanding (this data series does not include mortgages) to consumer spending is now above 26%, and well above the averages before the mid 1990s.
Ratio of Total Consumer Loans Outstanding to Consumer Spending
There is no real factual conclusion I can offer regarding the role of consumer credit in the economy. My opinion is that too much consumer credit outstanding constrains economic growth, and too little consumer credit outstanding constrains economic growth. The optimum consumer credit levels are likely a sliding scale based on a slew of dynamics - and I suspect one of the larger dynamics is rate of inflation (the higher the rate of inflation, the higher the optimum level of credit).
There is compelling (but far from conclusive) evidence that today's elevated levels of consumer credit is an economic headwind in a consumer driven economy.
Other Economic News this Week:
The Econintersect Economic Index for November 2014 is showing our index on the low side of a tight growth range for almost a year. Although there are no warning flags in the data which is used to compile our forecast, there also is no signs that the rate of economic growth will improve. Additionally there are no warning signs in other leading indices that the economy is stalling - EXCEPT ECRI's Weekly Leading Index at the zero growth line.
The ECRI WLI growth index value crossed slightly into negative territory which implies the economy will not have grown six months from today.
Current ECRI WLI Growth Index

The market was expecting the weekly initial unemployment claims at 265,000 to 285,000 (consensus 280,000) vs the 290,000 reported. The more important (because of the volatility in the weekly reported claims and seasonality errors in adjusting the data) 4 week moving average moved from 279,000 (reported last week as 279,000) to 285,000.
Weekly Initial Unemployment Claims - 4 Week Average - Seasonally Adjusted - 2011 (red line), 2012 (green line), 2013 (blue line), 2014 (orange line)

/images/z unemployment.PNG
Bankruptcies this Week: KiOR, Dendreon, Baxano Surgical,
Disclosure: None.


