
ADRs Best & Worst Report
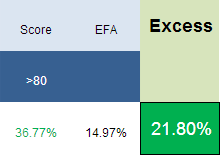
The best scoring ADRs from one year ago (7/22/2013) returned 2,180 bps more than the EFA in the past year. Returns have been led by SHPG up 150%, YPF up 126%, NOK up 106%, and BIDU up 74%.
The average score across our ADR universe is 56.71, below our four week moving average score of 58.08. The average ADR is trading -15.74% below its 52 week high, 2.54% above its 200 dma, has 4.25 days to cover held short, and is expected to post EPS growth of 19.8% next year.
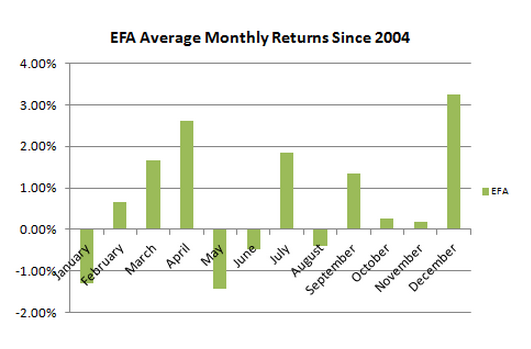
Over the past decade, August weakness has been a good time to increase your weight toward the MSCI EAFE for upside into year end.
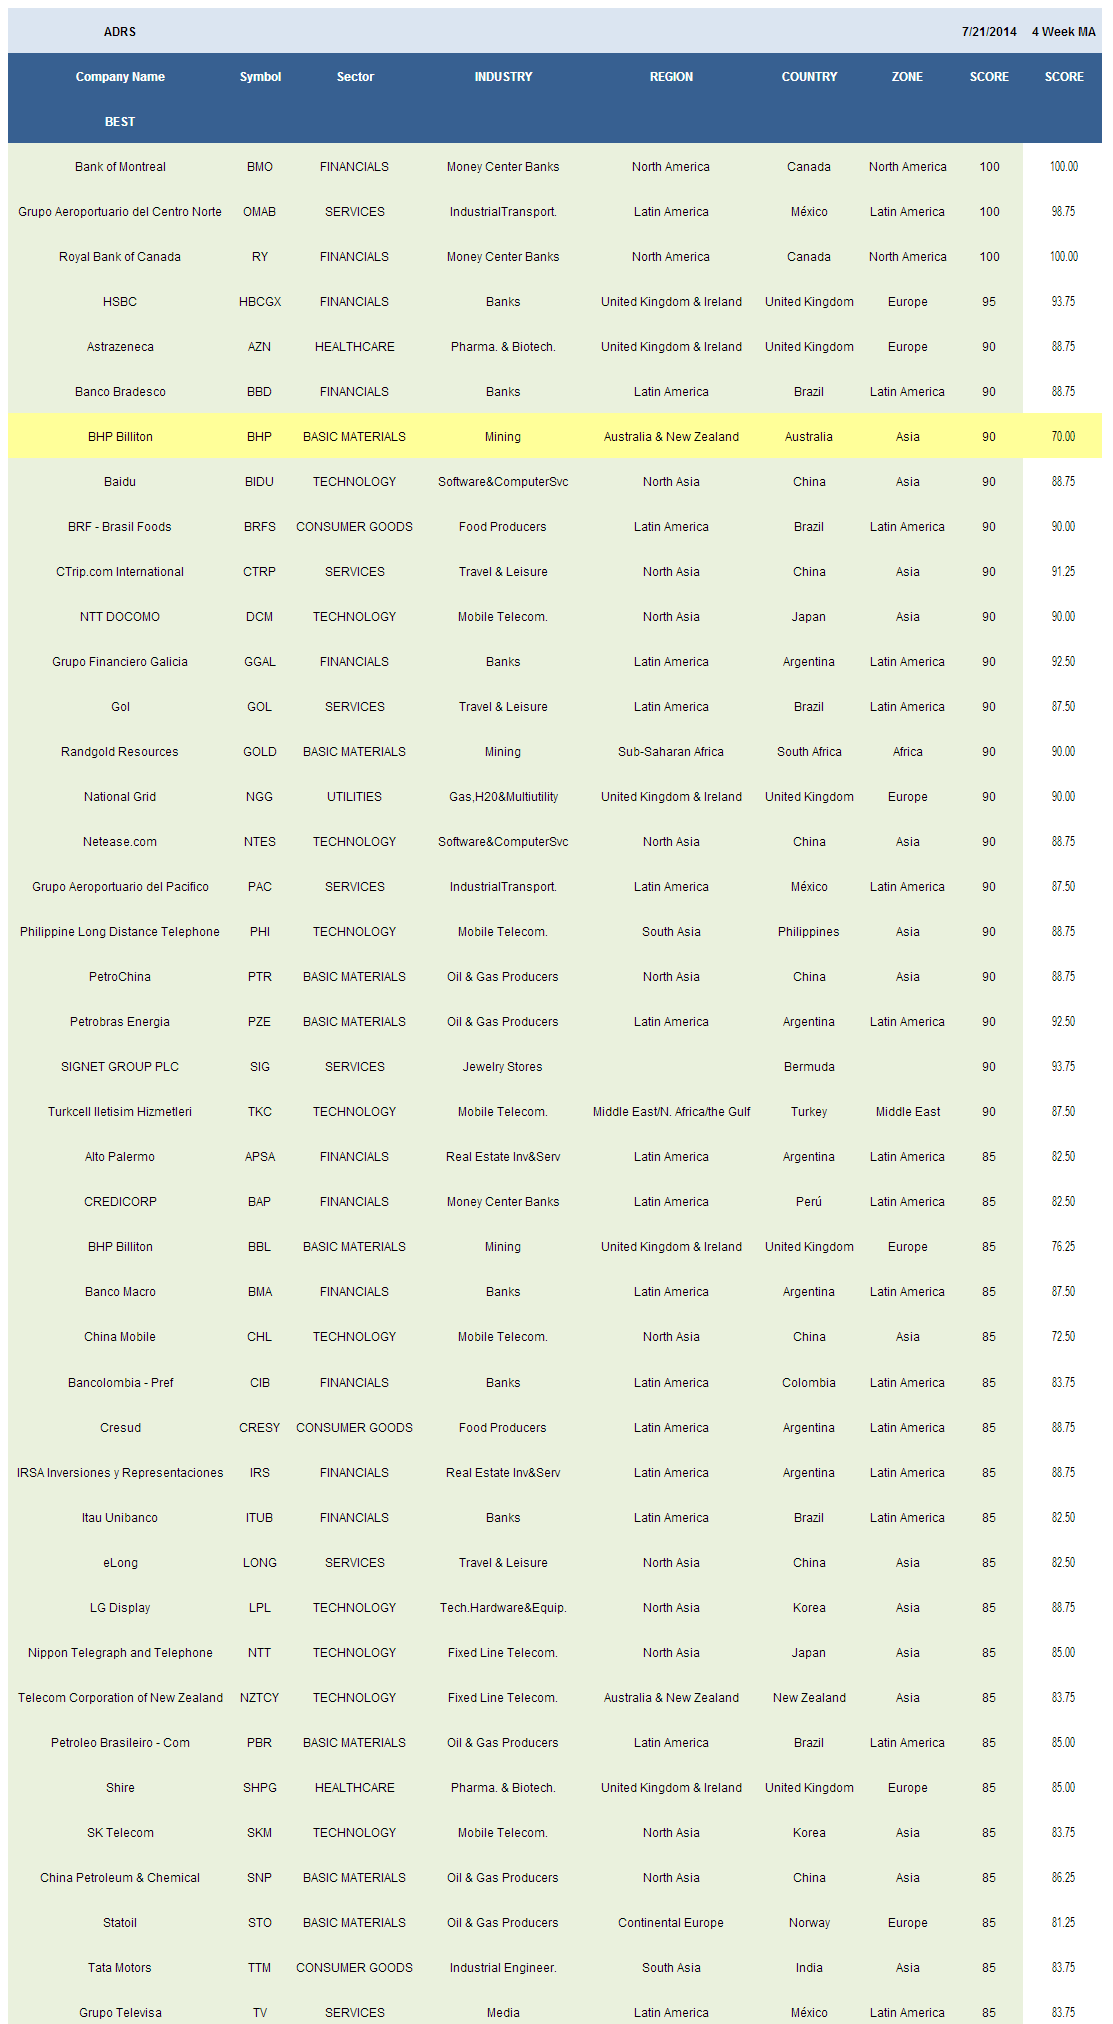
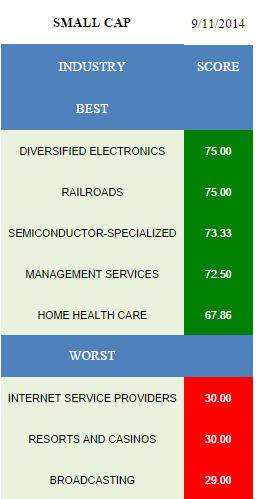
The best scoring sector across ADRs is basic materials (PZE, PTR, GOLD, BHP, STO, SNP, PBR, BBL, YPF, SSL, SID, RDSA). Utilities (NGG, HNP) and financials (RY, BMO, HBC, GGAL, BBD, ITUB, IRS, CIB, BMA, BAP, APSA) also score above average.
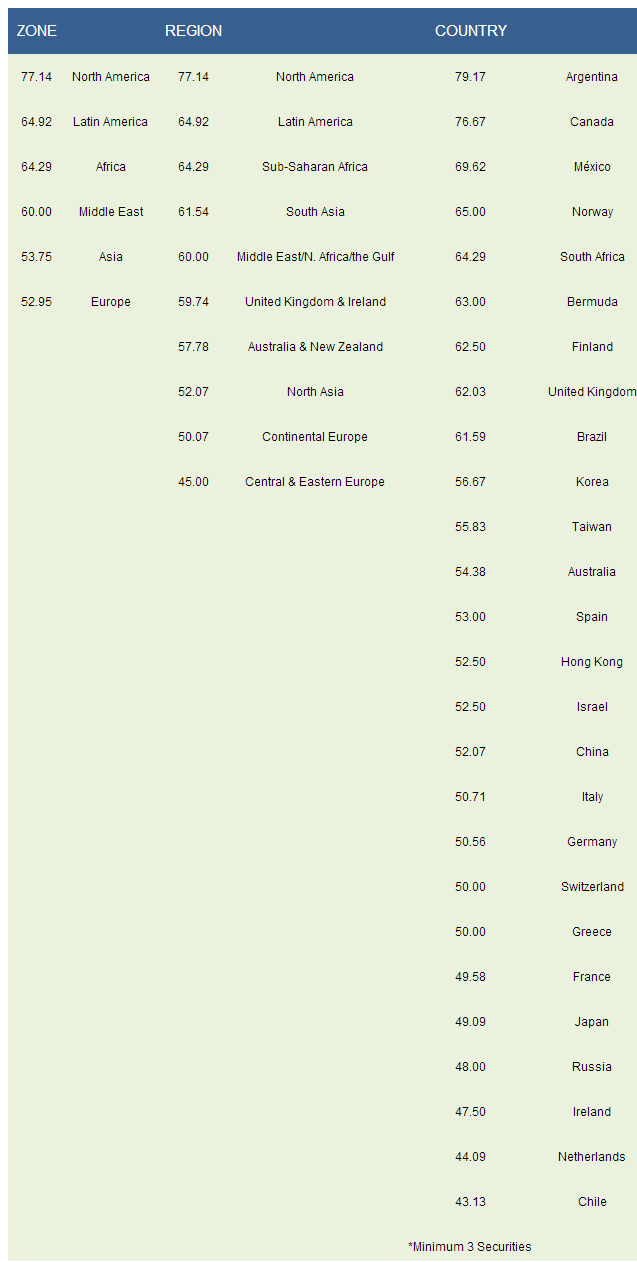
The top scoring region is North America/Canada (RY, BMO, PSDV, CNQ), followed by LatAm (OMAB, PAC, GOL, GGAL, BBD, BRFS, PZE, TV, ITUB, IRS, CIB, BMA, BAP, APSA, CRESY, PBR). The best regions are North America, LatAm, and Sub-saharan Africa (GOLD, SSL, AU). Own Argentina (GGAL, PZE, IRS, BMA, APSA, CRESY, YPF), Canada (RY, BMO, CNQ), Mexico (OMAB, PAC, TV, ASR), Norway (STO, NHYDY), and South Africa (GOLD, SSL, AU).
Disclosure: None.


