
EUR/USD Rate Carves Holding Pattern Within Bearish Trend
EURO TALKING POINTS
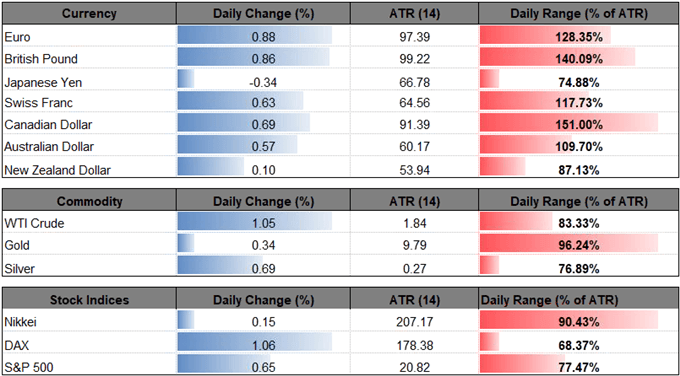
EUR/USD pares the decline from the previous week even as the European Central Bank (ECB) strikes a dovish outlook for monetary policy, and euro-dollar may continue to consolidate over the coming days as the exchange rate appears to be stuck in a near-term holding pattern.
(Click on image to enlarge)
EUR/USD RATE CARVES HOLDING PATTERN WITHIN BEARISH TREND
(Click on image to enlarge)

Headlines arising from the European Union (EU) Summit in Brussels suggest the ECB will continue to strike a dovish outlook for monetary policy as President Mario Draghi warns that a trade war may have a larger-than-anticipated impact on the euro-area economy, and the central bank may keep the door open to further support the monetary union as the quantitative easing (QE) program is now set to expire in December.
At the same time, the updates to the Euro-Zone Consumer Price Index (CPI) should keep the Governing Council on the sidelines as the core reading narrows to an annualized 1.0% from 1.1% in May, and the developments may encourage the ECB to merely buy more time at the next meeting on July 26 as the central bank struggles to achieve its one and only mandate for price stability.
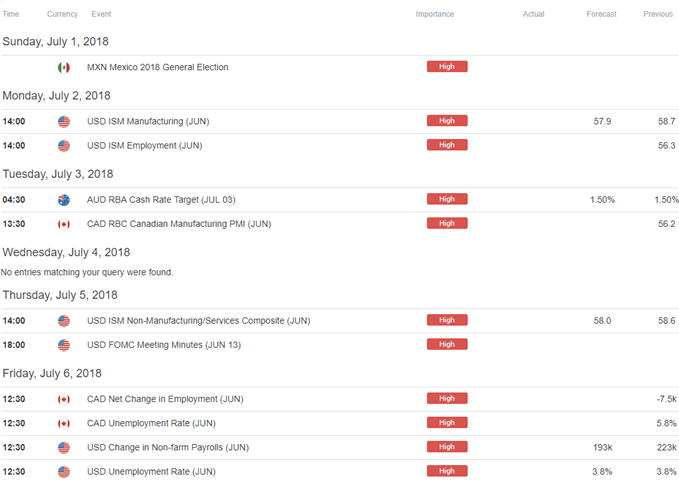
Looking ahead, Governing Council members Peter Praet, Yves Mersch, Ewald Nowotny, Daniele Nouy and Jens Weidmann are all scheduled to speak next week, and more of the same from the ECB officials may tame the recent rebound in EUR/USD especially as the central bank appears to be on track to carry the zero-interest rate policy (ZIRP) well into 2019.
EUR/USD DAILY CHART
(Click on image to enlarge)
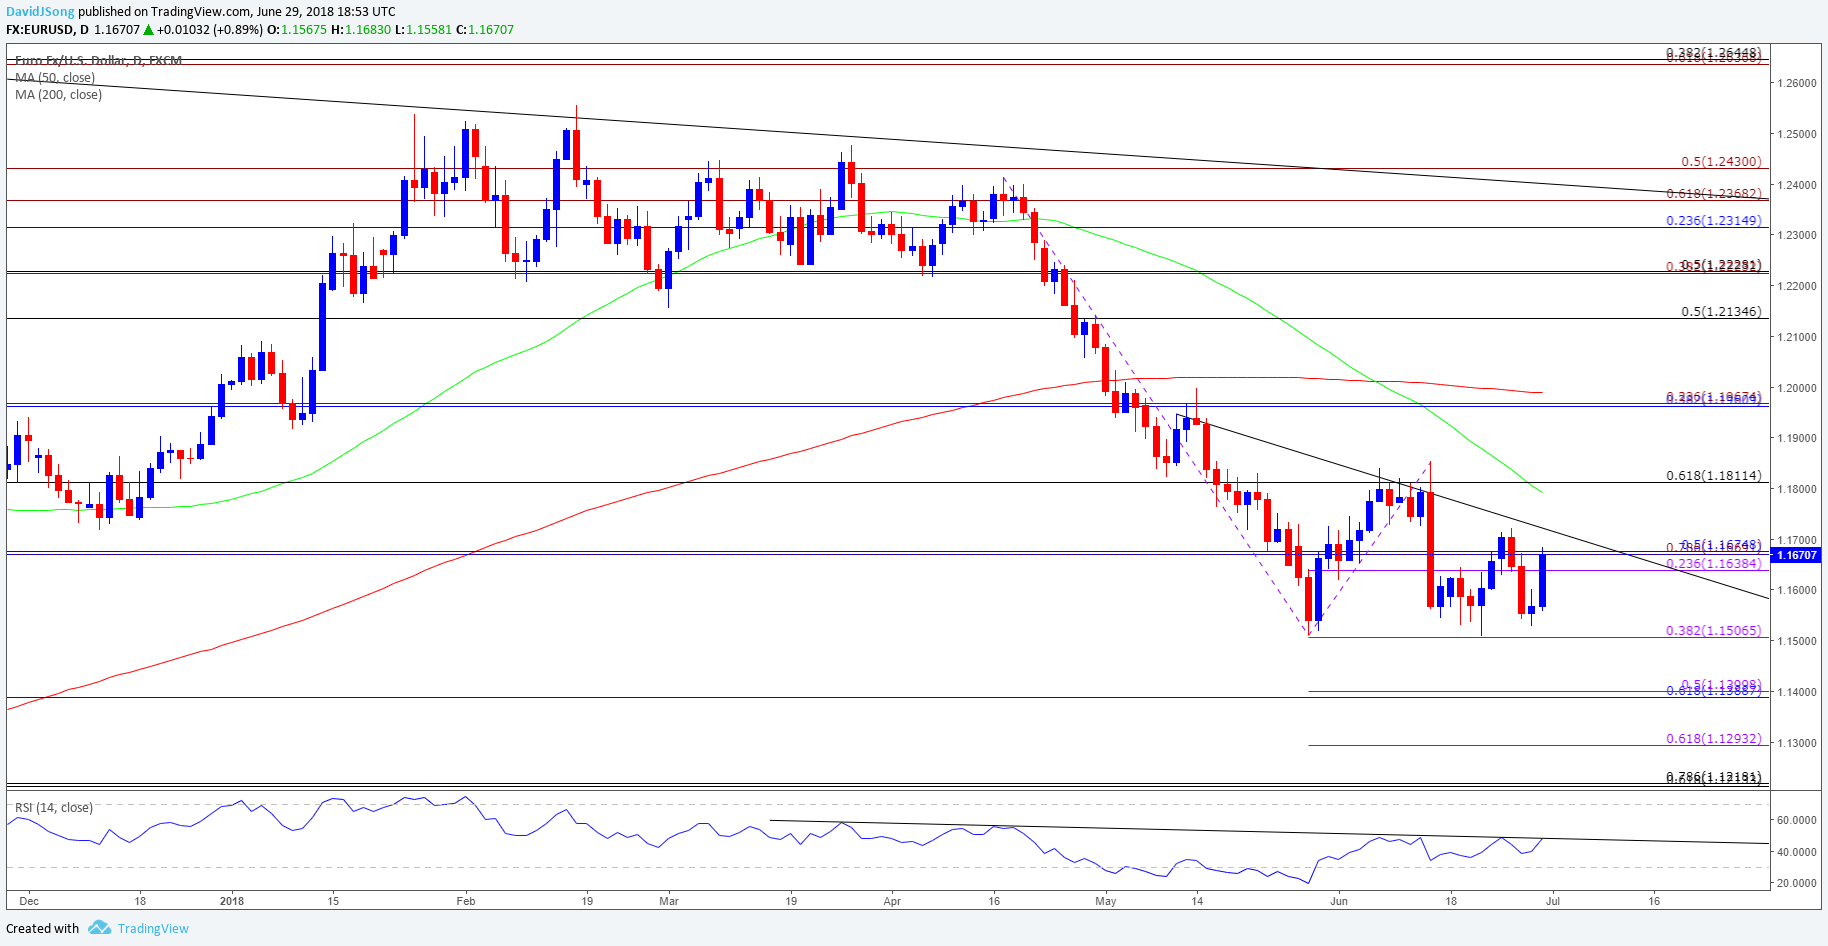
- Keep in mind, EUR/USD appears to be carving a triangle/wedge formation within a bearish trend, and the failed attempts to test the monthly-high (1.1852) keeps the path of least resistance tilted to the downside.
- Need a break/close below the 1.1500 (38.2% expansion) handle to open up the downside targets as both price and the Relative Strength Index (RSI) extend the bearish formations carried over from earlier this year.
- First downside region of interest comes in around 1.1390 (61.8% retracement) to 1.1400 (50% expansion) followed by the 1.1290 (61.8% expansion) hurdle.
(Click on image to enlarge)
Disclosure: None.


