
EURUSD Weekly Technical Outlook: Bottoming Or Set To Dive?
FX Traders’ weekly short and medium term technical EURUSD picture
The following is a partial summary of the conclusions from the fxempire.com weekly analysts’ meeting in which we cover outlooks for the major pairs for the coming week and beyond.
Overall Risk Appetite Per Weekly Charts Of Leading Global Stock Indexes
We skip this section this week because the modest bounce in risk appetite as reflected by the week’s bounce in the indexes does not help explain the EURUSD’s movements, as the usual positive correlation between the indexes and the EURUSD broke down last week.
Why? Both the indexes and the EURUSD reacted to the same developments in opposite ways. Specifically:
- Stocks were up mostly on a combination of a modest easing geopolitical fears and a ‘bad news is good news’ reaction to poor data worldwide, which had investors anticipating new or at least continued low rates from central banks.
- The EURUSD dropped on continued recognition that the ECB is much more likely to enact EUR-dilutive easing than the Fed, which is either going to keep policy steady or tighten a bit, with rates beginning to increase sometime between late 2014 to late 2015, as well as a belief that economic damage from Ukraine-related sanctions is far from over and will reinforce EU economic weakness and the ECB’s dovish stance.
Thus index movements didn’t help us explain EURUSD price action this week.
EURUSD Weekly Technical Outlook: Near Term Bottoming Or Breakdown Of Key Support?
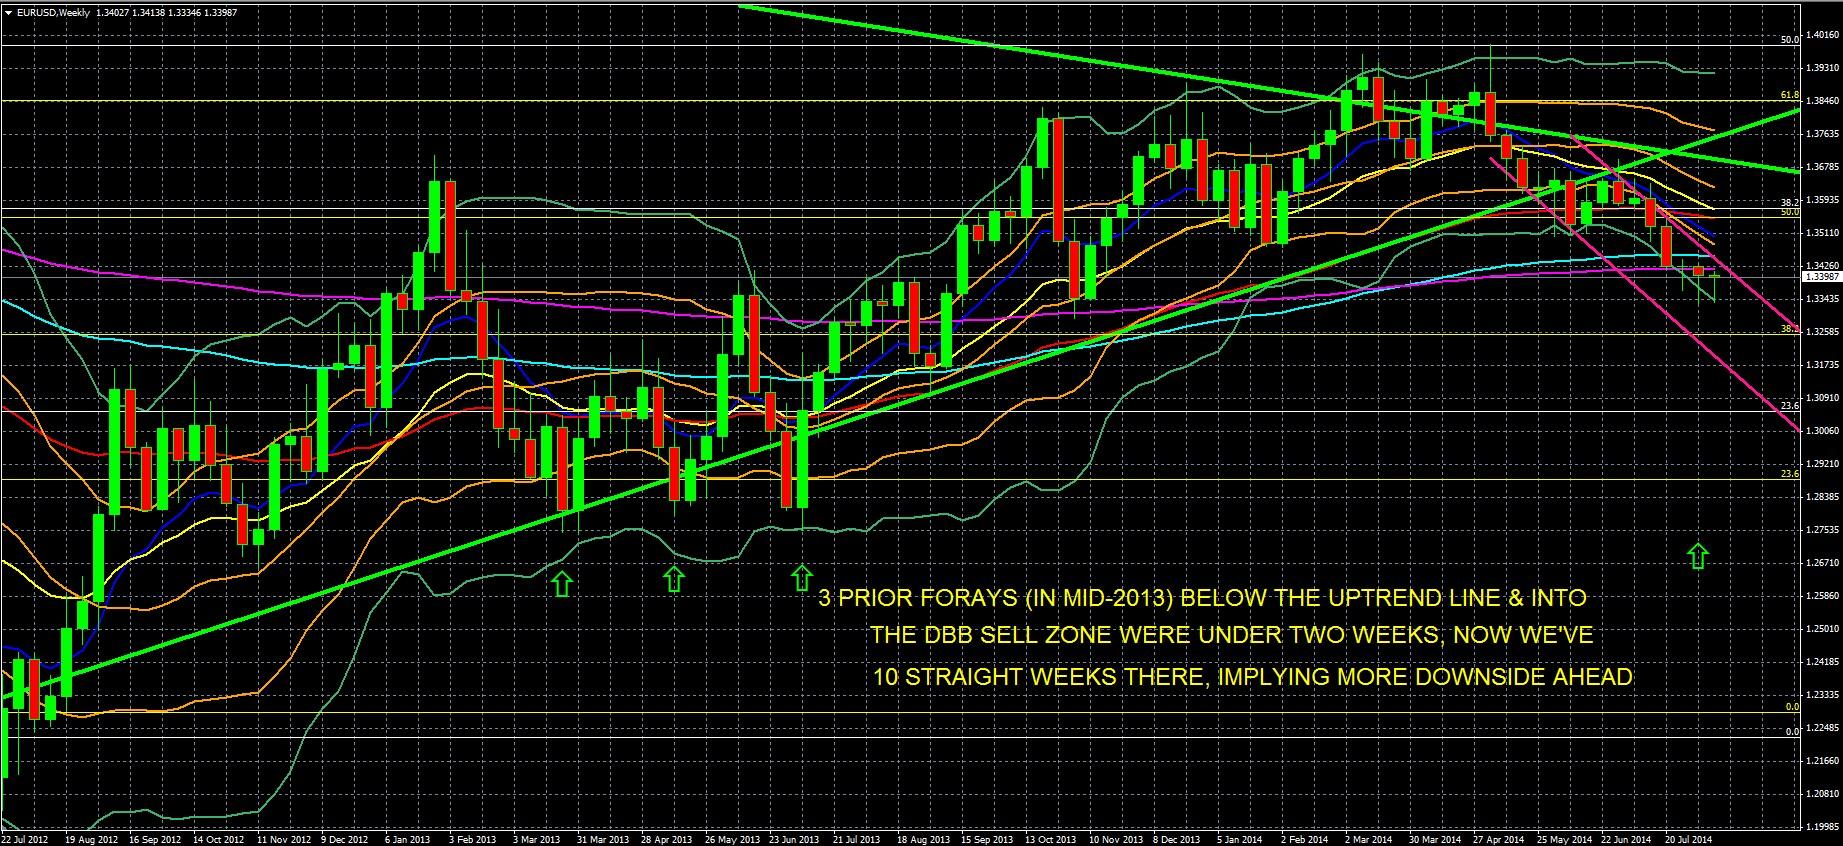
EURUSD Weekly Chart July 22 2012 to Present
KEY: 10 Week EMA Dark Blue, 20 WEEK EMA Yellow, 50 WEEK EMA Red, 100 WEEK EMA Light Blue, 200 WEEK EMA Violet, DOUBLE BOLLINGER BANDS: Normal 2 Standard Deviations Green, 1 Standard Deviation Orange. Green downtrend line from EURUSD peak of July 2008 to present, green uptrend line from August 2012 to present. White Fibonacci retracement lines for downtrend of August 2008 To June 2010, yellow Fibonacci retracement lines for downtrend of May 2011 To July 2011.
Source: MetaQuotes Software Corp, www.fxempire.com, www.thesensibleguidetoforex.com
01 Aug. 16 21.25
Key Take-Aways Weekly Chart: Key Support At Breaking Point, Next Levels To Watch
Continuing the theme of the past 5 weeks, the medium term outlook continues to deteriorate from a variety of technical perspectives, chart patterns, support breakdowns, and strengthening downwards momentum. In addition, the pair continued its slow grind down within its descending channel from May after a 5 week breakout above it.
The most outstanding change for the worst is the second straight weekly close below the last and strongest moving average, the 200 week EMA around 1.342. This second straight weekly close below it, along with a continued drop below it, brings us closer to calling a breakdown of this very significant support level.
As the oldest of our EMAs, such a confirmed breach takes real conviction among traders that the EURUSD is headed lower. The fundamental drivers of that conviction are clear, the poor EU economic data of the past week and continued potential for slowing growth from escalating military and economic sanctions activity. See our fundamental analysis for more on that.
That said, the weekly price action just wasn’t strong enough for us to declare support at the 200 week EMA around 1.342 officially broken yet:
- The EURUSD was essentially flat for the week despite bad data and the threat of more bad news from the Ukraine crisis.
- The close at 1.3399 is close enough to the 1.342 support level to consider this level merely bent but not yet decisively broken.
- The week’s candle is the second indecisive doji in three weeks, during which time the pair has only fallen about 260 pips.
In sum, one could still make a case that the pair is bottoming, though we would disagree, as both the technical and fundamental medium term picture remains overall bearish, especially in light of continued strong downward momentum on the above weekly chart, as we detail below.
Here are the details of the key elements of the technical picture on the weekly EURUSD chart.
- -Bearish Head And Shoulder Pattern Gets Further Confirmation: The past weeks additional declines, after the prior week’s pause (due to a below-forecast US jobs report), confirm the bearish medium term pattern. It’s hardly a classic H&S pattern given the head is dispersed over a few weeks and the somewhat asymmetrical and lopsided shoulders in December 2013 and June 2014 (the June shoulder’s a bit lower).
However the principal behind the H&S pattern applies here. That is, a failed attempt to rally, followed by further declines that suggest the EURUSD’s rally that began in mid-2012 is officially over.
Note the specific elements of the Head and Shoulders Topping Pattern:
-
- –We’ve a temporarily successful bounce off late January lows and drive a to new highs from December 2013 to March 2014
- –A pullback that bottoms in mid-June
- –A failed rally that tops out in early July, which, significantly, topped at resistance created by the medium term uptrend line dating back to June 2012, which proved its strength by resisting 4 straight weeks of tests. The current move lower has created a new series of lower lows and lower highs, aka a downtrend. The technical evidence of the new downtrend also includes violation of key support as detailed below.
- -Violation Of Key Support: Over the past 6 weeks the pair has broken through no less than 4 strong support levels, within which were 6 key technical support indicators:
- –1.3575 area, which included the medium term 38.2% Fib retracement of the long term downtrend beginning August 2008 – June 2010 (white).
- –13560 zone, which also included the 50% Fib retracement of the medium term downtrend from May – July 2011 (yellow), and the 50 week (200 day) EMA (red)
- –The 1.3455 area, which included the 100 Week EMA (turquoise)
- –And now, the 1.3400 support area, which included the very significant 200 Week EMA (violet) continues to bend.
- -Accelerating Downward Momentum
- —All EMAs trending lower except for the longest term, least sensitive 100 and 200 week EMAs, which have flattened. The 20 week EMAs (yellow) are close to crossing below the 50 week EMA (red), after the 10 week EMA (blue) crossed below it weeks ago. This would signal more entrenched momentum, as does…
- —The pair completes its 10th straight week in the DBB sell zone, and its 4th straight week of hugging the very bottom of this zone.
Likely Trading Range For The Week Ahead: 1.333 – 1.345.
Looking at both weekly and daily charts for the EURUSD:
- Upside limited to around 1.342 to 1.345 area, where it would meet resistance from prior week highs as well as from its 10 and then 20 day EMAs, along with its 100 and 200 week EMAs.
- Near-term downside appears limited to around 1.333, the lows of the prior 2 weeks, during which the pair has survived a growing stream of bearish data, geopolitical events, and ECB comments. More on these in our fundamental analysis.
- However there is really no significant intermediate term support showing on the weekly EURUSD chart until we hit the 1.325 area, where we’ve a convergence of both the 38.2% Fibonacci retracement of the uptrend that began in mid-2012 (yellow), and the lower edge of the descending channel (deep pink) that’s been carved out since May.
- In the near term, there is plenty of reason to believe there will be an attempted short term bounce. Consider:
- On the daily chart, the pair’s higher close on Friday puts it in its double Bollinger® band neutral zone.
- The indecisive weekly doji candle
- There was virtually no further net downward progress last week
- The already crowded EURUSD short position that makes the pair responsive to any kind of bullish news,
- That said, medium term momentum is overwhelmingly bearish and puts the odds in favor of a decisive break below the 200 week EMA another test of 1.333 in the coming weeks.
Concluding Thoughts: Medium Long Term Technical Outlook Strategic Summary
The theme of the current downtrend as evolved from one of “strengthening downward momentum versus strong support” to one of “downward momentum overwhelming final strong support.” Although the flat close for the week should encourage at least an attempted bounce this week, a test of support at 1.333 appears to be just a matter of time. After that, there’s no meaningful support until the 1.325 area.
As we cover in our fundamental analysis, the EURUSD’s downtrend is more a reflection of the EUR’s growing fundamental weakness in the EU rather than of any material strengthening of the US economy, which at best continues its fragile, mild ascent.
The recent violations of support and accelerating downward momentum open the way for a test of the next meaningful support level around the 1.333 zone, which provided support or resistance at many different times on the weekly EURUSD chart in 2013. After that, there’s no meaningful medium term support until around the 1.330 – 1.3255 band, which includes both these psychologically important round numbers as well as the 38.2% Fibonacci retracement of the May 2011 July 2012 downtrend.
The unequivocal message from the weekly charts is that the pair will find itself lower in the months ahead, albeit with possible normal counter trend moves within the longer term downtrend.
Again, another down week that widens the distance from that 200 week EMA would bring the confirmed breakdown of support at the last big medium term support level. It would be a very significant display of conviction for EURUSD bears and of capitulation among EURUSD bulls. You don’t sell around the 200 week EMA unless you really believe this downtrend has room to run.
Perspective Check: EURUSD Long Term Downtrend Since Mid-2008, Peaked At Start Of Great Financial Crisis
For perspective, remember that the EURUSD has been in a long term downtrend ever since July 2008, and its most recent highs of April 2014 were stopped cold by the already well-established downtrend line from mid-2008, as illustrated below.
EURUSD Monthly Chart 1 June 2005 to Present
KEY: 10 Month EMA Dark Blue, 20 Month EMA Yellow, 50 Month EMA Red, 100 Month EMA Light Blue, 200 Month EMA Violet, DOUBLE BOLLINGER BANDS: Normal 2 Standard Deviations Green, 1 Standard Deviation Orange. Deep pink downtrend line from EURUSD monthly opening peak of July 2008 to present.
Source: MetaQuotes Software Corp, www.fxempire.com, www.thesensibleguidetoforex.com
02 Aug. 16 21.53
That’s our technical outlook.
The above is for informational purposes only, responsibility for all trading or investing decisions lies solely with the reader.


