
EURUSD Weekly Technical Outlook: Downtrend Continuing?
FX Traders’ weekly EURUSD medium term technical picture, and likely EURUSD direction
The following is a partial summary of the conclusions from the fxempire.com weekly analysts’ meeting in which we cover outlooks for the major pairs for the coming week and beyond.
EURUSD Weekly Technical Outlook: Accelerating Deterioration From All Perspectives
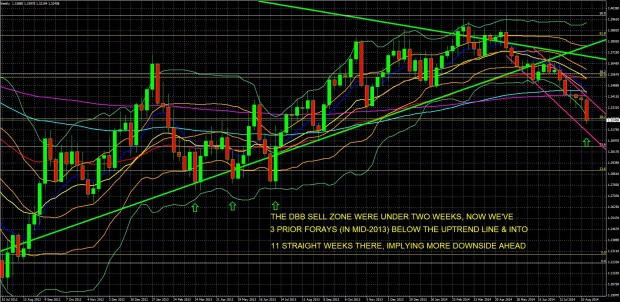
EURUSD Weekly Chart 15 July 2012 to Present
KEY: 10 Week EMA Dark Blue, 20 WEEK EMA Yellow, 50 WEEK EMA Red, 100 WEEK EMA Light Blue, 200 WEEK EMA Violet, DOUBLE BOLLINGER BANDS: Normal 2 Standard Deviations Green, 1 Standard Deviation Orange. Green downtrend line from EURUSD peak of July 2008 to present, green uptrend line from August 2012 to present. White Fibonacci retracement lines for downtrend of August 2008 To June 2010, yellow Fibonacci retracement lines for downtrend of May 2011 To July 2011.
Source: MetaQuotes Software Corp, www.fxempire.com, www.thesensibleguidetoforex.com
03 Aug. 23 23.54
Key Take-Aways Weekly Chart: Bounce or Key Support Breaking? Next Levels To Watch
Continuing the theme of the past 6 weeks, the medium term outlook continues to deteriorate from a variety of technical perspectives, chart patterns, support breakdowns, and strengthening downwards momentum. In addition, the pair’s slow grind lower within its descending channel from of the past 3 weeks accelerated decisively, as Ukraine tensions, data, and central bank expectations all turned further in favor of the USD. See our fundamental analysis for details, of which there are many.
The most outstanding change for the worst is the third consecutive penetration of yet another key support level in as many weeks.
Three weeks ago the pair decisively broke through its 200 week EMA around 1.342 As the oldest of our EMAs, such a confirmed breach takes real conviction among traders that the EURUSD is headed lower..
Last week confirmed that downward breakout with a modestly lower weekly close, yet support at the 1.333 level held for the third straight week despite plenty of bearish news from both the Ukraine crisis and the economic data, offering EURUSD bulls hope for an oversold bounce.
However the past week illustrated how poor most momentum and positioning indicators are for timing bounces, and how it pays to stay short as long as the pair remains within its double Bollinger® band sell zone. The pair not only took out that 1.333 level, it closed Friday below the next major support level at the 38.2% Fibonacci retracement level of the uptrend of August 2012 – May 2014 at 1.3245, to close around 1.3242.
Here are the details of the key elements of the technical breakdown on the weekly EURUSD chart.
- -Bearish Head And Shoulder Pattern Gets Further Confirmation: The past weeks additional declines, after the prior week’s pause (due to a below-forecast US jobs report), confirm the bearish medium term pattern. It’s hardly a classic H&S pattern given the head is dispersed over a few weeks and the somewhat asymmetrical and lopsided shoulders in December 2013 and June 2014 (the June shoulder’s a bit lower).
However the principal behind the H&S pattern applies here. That is, a failed attempt to rally, followed by further declines that suggest the EURUSD’s rally that began in mid-2012 is officially over.
Note the specific elements of the Head and Shoulders Topping Pattern:
-
- –We’ve a temporarily successful bounce off late January lows and drive a to new highs from December 2013 to March 2014
- –A pullback that bottoms in mid-June
- –A failed rally that tops out in early July, which, significantly, topped at resistance created by the medium term uptrend line dating back to June 2012, which proved its strength by resisting 4 straight weeks of tests. The current move lower has created a new series of lower lows and lower highs, aka a downtrend. The technical evidence of the new downtrend also includes violation of key support as detailed below.
- -Violation Of Key Support: As noted above
- -Accelerating Downward Momentum
- —All EMAs trending lower except for the longest term, least sensitive 100 and 200 week EMAs, which have flattened. The 20 week EMA (yellow) appear set to cross below the 50 week EMA (red), after the 10 week EMA (blue) crossed below it weeks ago. This would signal more entrenched momentum, as does…
- —The pair completes its 10th straight week in the DBB sell zone, and its 4th straight week of hugging the very bottom of this zone.
Likely Trading Range For The Week Ahead: 1.317 – 1.3425.
Looking at both weekly and daily charts for the EURUSD:
- Upside limited to around 1.3425 area, where it would meet resistance from prior three week highs as well as from its 200 week EMA and the upper edge of its descending channel.
- Near-term downside is a bit harder to call. The week’s close at 1.3242 is too close to the 38.2% Fibonacci level of the August uptrend truly broken, so if the Ukraine situation and US data advantage don’t escalate, the pair has a chance for some kind of bounce on profit taking, especially given the crowded short position on the pair.
- However if this level doesn’t hold below this level there is really no significant intermediate term support showing on the weekly EURUSD chart until we hit the lower edge of the descending channel, all the way down around the 1.317 area.
Concluding Thoughts: Medium Long Term Technical Outlook Strategic Summary
The theme of the current downtrend as evolved from one of “strengthening downward momentum versus strong support” to one of “downward momentum overwhelming final strong support,” as the past week saw the prior 3 week’s support smashed and support at the 38.2% Fibonacci level bent. This had held since mid-late 2013, depending on where you place its first test.
As we cover in our fundamental analysis, the EURUSD’s downtrend is more a reflection of the growing fundamental weakness in the EU, aided by fears of added drag from Ukraine, rather than of any dramatic strengthening of the US economy or of expectations of a Fed rate hike, though both bullish USD drivers got some support last week, as we detail in our fundamental analysis.
The unequivocal message from the weekly charts is that the pair will find itself lower in the months ahead, albeit with possible normal counter trend moves within the longer term downtrend.
Perspective Check: EURUSD Long Term Downtrend Since Mid-2008, Peaked At Start Of Great Financial Crisis
For perspective, remember that the EURUSD has been in a long term downtrend ever since July 2008, and its most recent highs of April 2014 were stopped cold by the already well-established downtrend line from mid-2008, as illustrated below.
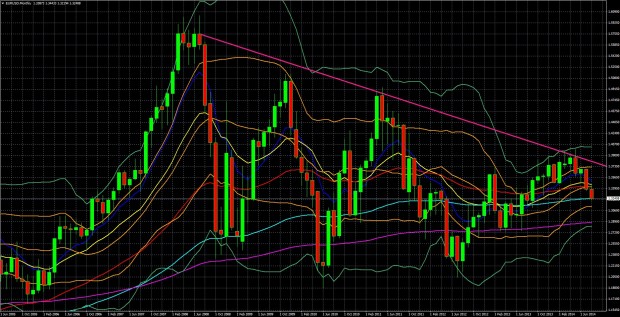
EURUSD Monthly Chart 1 June 2005 to Present
KEY: 10 Month EMA Dark Blue, 20 Month EMA Yellow, 50 Month EMA Red, 100 Month EMA Light Blue, 200 Month EMA Violet, DOUBLE BOLLINGER BANDS: Normal 2 Standard Deviations Green, 1 Standard Deviation Orange. Deep pink downtrend line from EURUSD monthly opening peak of July 2008 to present.
Source: MetaQuotes Software Corp, www.fxempire.com, www.thesensibleguidetoforex.com
04 Aug. 24 00.34
See here for separate fundamental analysis, here for comprehensive technical and fundamental analysis.
The above is for informational purposes only, responsibility for all trading or investing decisions lies solely with the reader.


