
Market Outlook: Cautiously Optimistic Here
It wasn't a riveting gain, but it was a still a gain. The S&P 500 (SPX) (SPY) was able to eke out a 0.6% advance last week, renewing hopes that we'd be able to sidestep an overdue correction and instead keep chugging higher. Yet, there's a red flag waving in the background again.
We'll look at what hat red flag is after slicing and dicing some key economic numbers.
Economic Calendar
There wasn't a lot of economic data unveiled last week, but some of what we got was immensely important. That important data, of course, was December's unemployment rate and job growth. Once again we heard a mixed message.
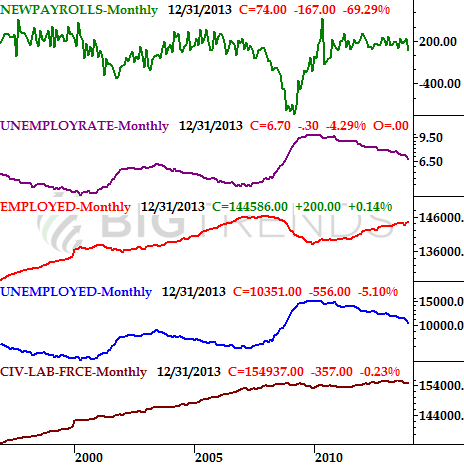
The good news: The United States' unemployment rate fell from 7.0% to 6.7% last month. The bad news: Only 87,000 jobs were created in December. That's well below the 2013 monthly average of around 190,000. Cold weather got the blame, but that's a fairly lame excuse.
As for the drastic drop in the unemployment rate, that's a bit misleading too. While the number of employed people went up a little, the number of people who are in the workforce dropped even more. Specifically, the number of people with a job grew by 200,000, reaching 144.6 million. However, the number of people in the labor force (employed or not) fell by 357,000, to 155.0 million. That's the number used to determine the unemployment rate though, so if it drops artificially – and it did – it makes the ratio of officially-unemployed-to-labor-force ratio (aka the unemployment rate) look abnormally low.
Still, the basic employment picture is looking slightly better; the number of people with jobs is on the rise.
Employment Snapshot, as of December
The only other news of real consequence last week was November's factory orders. They grew by 1.8%, versus expectations of 1.7% growth. That compares favorably to October's 0.5% decline. Truth be told though, any November data is old news by early January, which is why the factory orders number means little to us now, and meant little to the market on Monday.
Everything else is on the following grid.
Economic Calendar
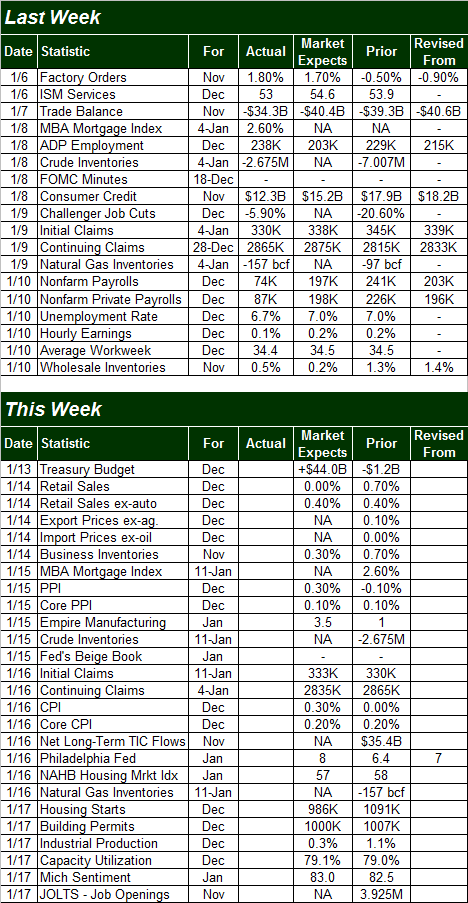
The coming week is going to be a pretty busy one, kicking off with December's retail sales figures on Tuesday. The buzz is that holiday shopping was weak this year, so Tuesday's numbers will either confirm or deny that suspicion.
We're also going to get an update on the inflation situation, with the PPI number coming out on Wednesday, and the CPI figure due on Thursday. As of the last look, the annualized consumer inflation rate stood at 1.24%, up a tad from October's 0.96% (which was getting uncomfortably low). Another weak reading could mean the economy is too weak to sustain pricing power.
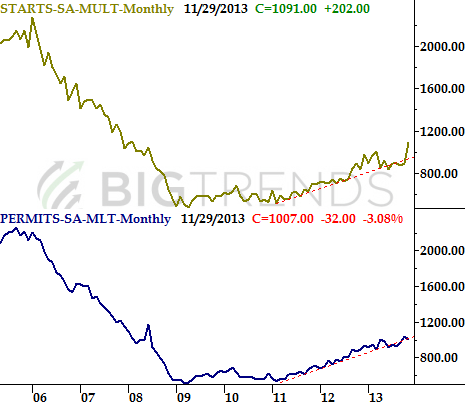
Also on Thursday we'll hear December's housing starts and building permits. The pros say we should basically get a repeat of November's construction data, which was pretty good. In fact, the construction market's growth has been impressive for quite some time.
Housing Starts & Building Permits
Finally – and for a grand finale – on Friday we'll hear last month's industrial productivity and capacity utilization figures. Economists aren't expecting particularly impressive improvement for either data set. This could be an opportunity for a catalytic "beat" that sparks some bullishness, even though the market doesn't usually seem to care about these two data points.
Stock Market Index Analysis
Despite the odds being stacked against it, the S&P 500 managed to renew its uptrend last week. It wasn't red hot bullishness, but we spent the bulk of last week making higher highs and higher lows. The last-minute buying spree late in the day on Friday afternoon says a lot about how traders are feeling when forced to make a big decision – they saw more risk in being out of the market than in the market. And, though volume wasn't explosive, the volume behind last week's bullishness was reasonably solid. You'll also see the S&P 500 isn't bumping into either of its upper Bollinger bands just yet, so there IS some room to keep rolling here.
S&P 500 & VIX – Daily Chart
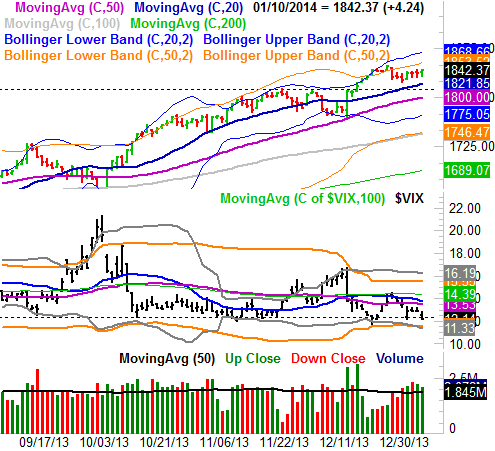
There's a flipside to that bullish coin, however. In fact, you may have already seen it. The CBOE Volatility Index, or VIX (VIX) (VXX), is back to a major floor around 12.3. This says there's a stunning (perhaps dangerous) amount of complacency backing investor opinion here… and that's dangerous. You don't have to look too far back to see how the market has a tendency to pull back when the VIX gets this low – the punishment for too much confidence in stocks.
That's not to say the market absolutely hast to go through a correction here; it's entirely possible the VIX could start to inch higher, burning off the unhealthy degree of confidence without forcing the S&P 500 or other major indices to give up a lot of ground. It's just that it's a rarity to see it happen that way. More often than not, a VIX this low mean trouble is in store for stocks.
With all of that being said, note there's a significant swath of support between 1800 and 1820, framed by the 50-day moving average line and the 20-day moving average line. We'll let each of those lines take a crack at acting as support before assuming the worst for the broad market; the S&P 500's lower 20-day Bollinger band could be at 1800 by the time the 50-day moving average line (purple) is tested as a floor. A break under that floor would also (likely) coincide with the VIX popping above its confluence of resistance between 13.5 and 14.0.
Of course, the bearish discussion is moot if the S&P 500 continues to march higher at a decent pace. In fact, the pace is half the battle. If the bulls move too fast they'll put the market right back into the overbought situation it was on two weeks ago. The best thing it could do to ensure there's some longevity to this uptrend is simply walk higher, without attracting too much attention.
Yes, there's a lot going on right now, and that unpredictability is only going to be made worse now that we're wading into earnings season.
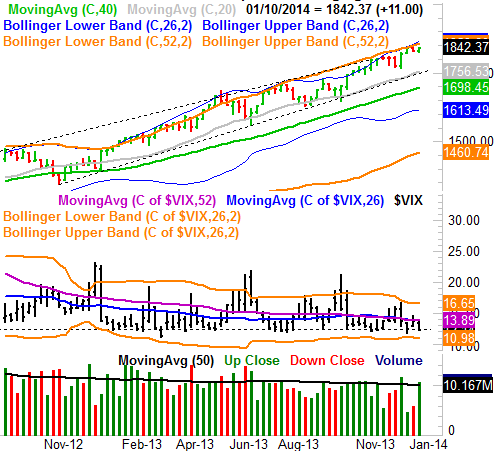
The cautiously-bullish outlook doesn't really change when we zoom out to a weekly chart, but just for the sake of continuity we'll add a weekly chart of the S&P 500 all the same. It's here we can see why the VIX's low value of 12.1 is a short-term worry, but it's also here we can see how well this bull market is moving. We can also see on the weekly chart how even the 1800-ish area fails to hold up as support, there's a long-term support line around 1756 (and rising) ready to step up to the plate and act as a floor.
S&P 500 & VIX – Weekly Chart
None.


