
Mind The (Output) Gap
Yesterday’s advance GDP release for 2014Q3, covered by Jim, was welcome news, and was something Jeff Frieden and I predicted at the beginning of the year [1]. However, while growth seems to be firming, it is far too soon to take away stimulus. Figure 1 shows that the degree of economic slack remains large.
The Output Gap Remains
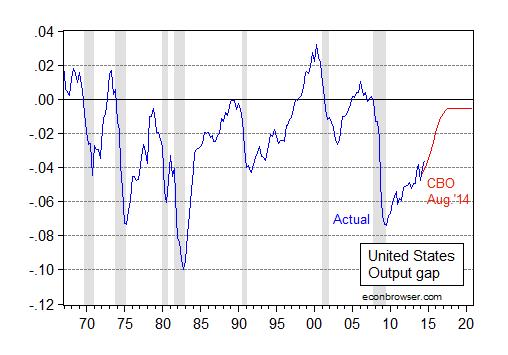
Figure 1: Output gap (blue) and projected using August 2014 CBO projection. Source: BEA, 2014Q3 advance, CBO An Update to the Budget and Economic Outlook: 2014-2024 (August 2014).
The current output gap is 3.6% (log terms); this is larger in absolute value than the gap when the G.W. Bush proposed a second round of tax cuts to stimulate the economy (even if they were ill-designed to do so). Even by end-2015, the gap is projected by CBO to be 2.3%.
Downside Risks Remain
While output is currently exceeding the August 2014 CBO forecast, there remain definite downside risks. Two spending components accounted for a large portion of growth over the last two quarters: exports and government.
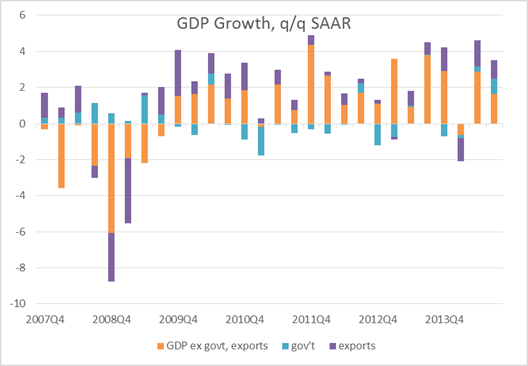
Figure 2: Contributions to growth from all except exports and government (orange), government (blue) and exports (purple), q/q SAAR, %. Source: BEA 2014Q3 advance and author’s calculations.
It is unclear why government (defense) expenditures rose so much in 2014Q3, but in any case it would not make sense to bet on continued defense spending at elevated levels.[2] Exports are growing strongly for now, but the slowdown in Europe and China puts in doubt that sustaining force (although Goldman Sachs [10/21/2014, not online] observes that a 0.3 ppt markdown in RoW growth implies a 0.1 ppt reduction in US growth, using the Fed’s FRB/US model.)
Misplaced Concerns about Inflationary Pressures
Despite the fact that the output gap is still large, and substantial downside risks to the outlook persist, I hear people worrying about wage inflation, particularly given the 3% (annualized) upward movement in the 2014Q3 Employment Cost Index (ECI) reported today. As always, it’s important to keep these numbers in context. The ECI has risen roughly the same amount as the CPI since the last peak in 2007Q4. This is fact is illustrated in Figure 3.
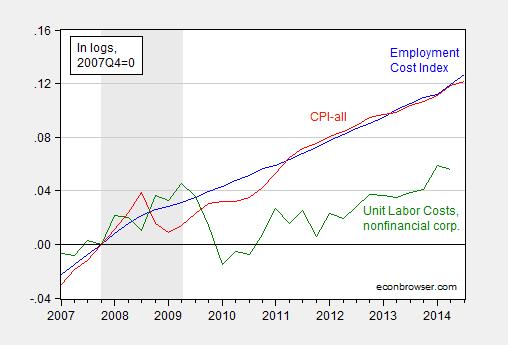
Figure 3: Log Employment Cost Index (blue), CPI-all (red), and unit labor cost index for nonfinancial corporations (green), all normalized to 2007Q4=0. NBER defined recession dates shaded gray. Source: BLS, and BEA via FRED, NBER, and author’s calculations.
Note that the co-trending of the ECI and CPI implies a constant real wage, while (as we know) productivity has been rising. In fact unit labor costs in the nonfinancial corporate sector in 2014Q2 was only 1.1% higher than the previous peak in 2009Q2. In other words, rapid productivity growth has not shown up in wages thus far, and when a little bit does, there is panic in the (Wall) Street. If indeed we are serious about reversing the declining share of labor in national income, then we should not fear a little wage growth. Another way of viewing the increase in wages is that it represents a small shift in balance of monopsony power between capital and labor (not literally monopsony but monopsonistic competition). From Larry Meyer in “Wage-Setting Power and the Labor Share of Income,” Macro Focus 9(6) (Macroeconomic Advisers, October 14):
…when firms have wage-setting power in labor markets (as represented here),
1. employment is lower than when firms do not have wage-setting power,
2. nominal and real wages are lower than when firms do not have wage-setting
power,
3. the real wage is below the marginal product of labor, and
4. the labor share of income is lower than when firms do not have wage-setting
power.To this point, we have explained why the labor share of income is lower in the case of monopsony than in the case of perfect competition, but we have not explained the declining labor share of income exhibited over the last 15 years or so. We view the conditions that have given rise to wage-setting power on the part of firms as having evolved over time, leading to wage-setting power that has increased over time and a labor share of income that has decreased over time.
Moreover, if inflation expectations are well anchored, we should not be worrying about higher wage costs feeding into inflation. (Note that if anything, expected inflation is dropping.)
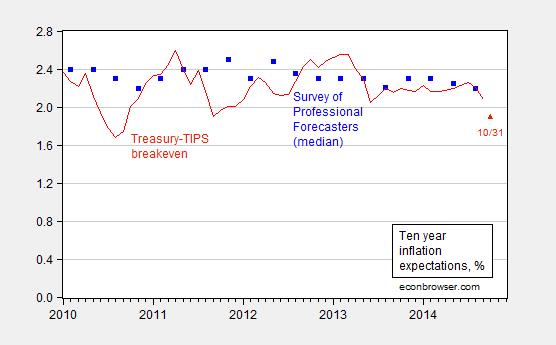
Figure 4: Median ten year expected CPI inflation from Survey of Professional Forecasters (blue square), Ten year constant maturity Treasury-TIPS spread (red). Source: Federal Reserve Board via FRED, Philadelphia Fed.
Disclosure: None.


