
New Year Brings A New Trend? – Weekly Market Outlook
The Santa Claus rally is in full swing this year. Even with the market being closed on Wednesday (and half of Tuesday), the S&P 500 (SPX) (SPY) managed to advance 1.26% last week, reaching further into new-high territory.
If the norm for this time of year repeats itself, the bulls should hit the ground running this coming week, and statistically speaking, things will likely be bullish for the first few days of the new year, beginning on Thursday. Problem: with a market already up 3.7% since the mid-September lull – and up 29% year-to-date – one has to wonder how much, if any, room is left to keep rallying.
We'll take a look at that question in a moment, right after a brief look at last week's economic numbers.
Economic Calendar
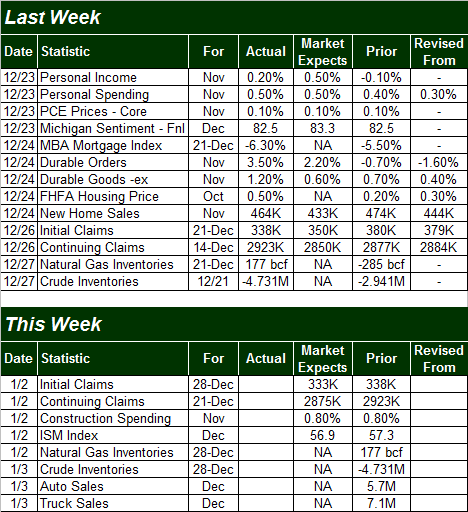
There wasn't much in the way of economic data last week, with the Christmas break causing much of it to be delayed. There were a couple of key announcements though, particularly on the real estate front. It was relatively good news. FHFA says home prices were up in October, while new home sales rolled in better than expected. Specifically, the price of houses sold a couple months ago was up 0.5%, and new home sales reached a pace of 464,000 in November. That was down from October's 474,000, but topped expectations of 433,000.
Real Estate Activity
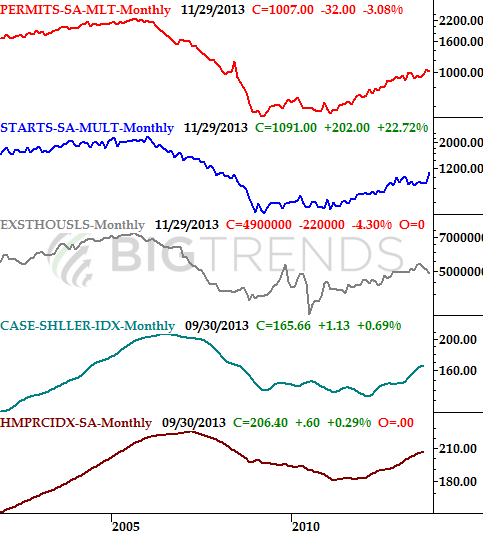
The only other big news about the economy last week was durable orders. They were up 3.5% in November, when including planes and autos. But, when factoring in transportation orders, the growth pace fell to only 1.2%. Still, that's a solid figure.
Everything else (which isn't much) is on the following grid. There's also not much in the lineup for this week.
Economic Calendar
Stock Market Index Analysis
First and foremost, take everything you saw and heard last week – as well as what you're about to hear and see – with a grain of salt. While things have been and likely will be bullish for a couple more days, but it's not a reflection of the majority opinion. Volume has been remarkably low of late, and should be pretty thin until Thursday (after the New Year's break).
On the flipside, no matter where things go for the market during this year-end period, wherever stocks end up closing on Tuesday will be roughly where they start on Thursday. Not only will volume and interest be back to normal then, that's when the majority will start to correct any errant moves made recently. That being said…
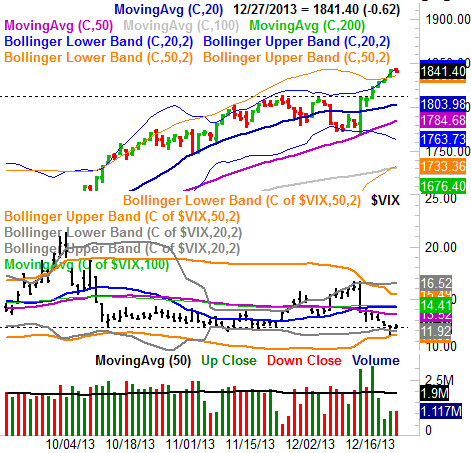
Check out the daily chart of the S&P 500 below. It's been a great seven-day run, but having run into the upper 20-day Bollinger band last week, the weight of the gain is starting to bear down. Perhaps even more alarming is the fact that the CBOE Volatility Index (VIX) (VXX) finally bumped into its lower Bollinger band lines, and has even started to inch its way higher.
SPX & VIX - Daily Chart
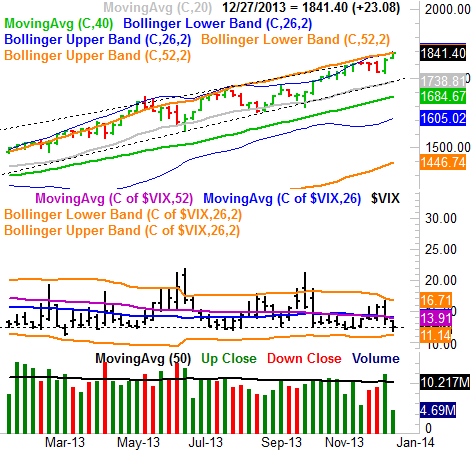
Not a lot changes when you zoom out to a weekly chart – the S&P 500 is bumping into some serious resistance in this timeframe as well. Here, it's the upper 26-week as well the upper 52-week Bollinger band, in addition to straight-line resistance (dashed) all holding the bulls back. Had those lines not acted as resistance before, it might be dismissible now. But, it's clear that all those lines have been problem areas before. Therefore, odds are good they'll be problems again.
S&P 500 & VIX – Weekly Chart
It's not like the S&P 500 is unique in the increasingly-alarming picture being painted here. The NASDAQ Composite (COMP) (QQQ) also started to fade on Friday after a week and a half worth of gains. The NASDAQ's Volatility Index, the VXN, is also pushing upward off of its lower Bollinger band, suggesting sentiment is trying to turn in a bearish direction for stocks.
NASDAQ Composite & VXN – Daily Chart
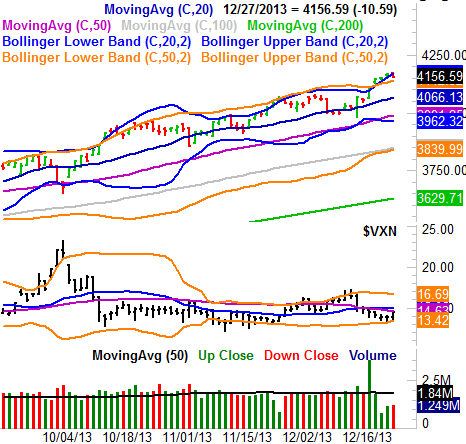
When you put it all together, it doesn't bode well for the market heading into the new year. Again though, it can't be stressed enough… this is a goofy time of year, and just because something should or shouldn't happen doesn't mean that's the way things will be. Just know that, based on the odds being laid out by the current charts, the market's about to hit a headwind.
That being said, the short-term overbought situation isn't the only headwind the market could be hitting soon. On a long-term basis, stocks could be hitting a valuation wall soon as well.
As of Friday's close, the S&P 500 is trading at a trailing P/E ratio of 17.1. That's as high as it's been since the bull market began (and profits were being seen again) in 2010. The market can rally to higher valuations, and with a forward-looking P/E of 15.56, there's room for growth over the coming four quarters. There's not a lot of room though, and traders may decide there's too much risk versus the reward at the market's current levels. The "fix" is a more significant pullback to give stocks some room to climb in 2014 without pushing its valuation luck.
S&P 500 Valuation (Earnings, Past and Projected, and P/E Ratio)
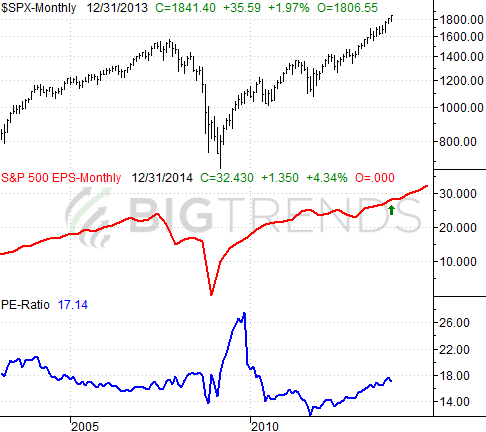
The tricky part about overvalued stocks is that it can take weeks if not months, for investors to right-size the market. In the meantime, we're still waiting to see convincing proof that stocks are going to actually dole out a short-term pullback. Being vulnerable now doesn't actually mean it's going to happen now. A move under the 20-day moving average lines would be a good start to that end.
Trade Well.
None.


