
Initial Unemployment Claims At Lowest Levels Since End Of Housing Bubble And End Of Tech Bubble
Courtesy of Lee Adler of the Wall Street Examiner
The Labor Department reported that in the week ending November 16 the advance figure for seasonally adjusted (SA) initial claims was 323,000, a decrease of 21,000 from the previous week’s revised figure of 344,000 (was 339,000).
The consensus estimate of economists of 333,000 for the SA headline number was too pessimistic (see footnote 1). Stocks rose after the release and bonds sold off. The ritual of reacting to fictional, seasonally adjusted headline numbers goes on.
The upward revision of 5,000 to last week’s number was larger than usual this week for a second straight week. The number is always revised up because the advance number reported the first week does not include all interstate claims. By the following week they are all counted. The usual upward revision is from 1,000 to 4,000. This one was larger than typical. The revision also impacted the not seasonally adjusted actual count, where 5,600 claimants didn’t make it into last week’s count in time to make the reporting cutoff.
The headline seasonally adjusted data is the only data the media reports but the Department of Labor (DOL) also reports the actual data, not seasonally adjusted (NSA). The DOL said in the current press release, “The advance number of actual initial claims under state programs, unadjusted, totaled 322,510 in the week ending November 16, a decrease of 40,996 from the previous week. There were 403,637 initial claims in the comparable week in 2012.” [Added emphasis mine] See footnote 2. The 2012 number was boosted sharply by Superstorm Sandy, which had swept across the northeast coast of the US two weeks before. In addition, the current week was artificially depressed by Veterans Day on Monday of that week. State unemployment offices were closed, so some claims may not have been filed, although it’s reasonable to assume that most claimants would have made it in to file over the rest of the week. In 2012, Veterans Day fell on a Sunday.
After jumping during the government shutdown, claims have returned to trend, in the past couple of weeks being on the strong side of the trend. That is partly due to the comparisons with the post Superstorm Sandy spike in 2012. Actual filings last week were down 19.1% versus the corresponding week last year. The trend average is -8.4% per year over the past 104 weeks.
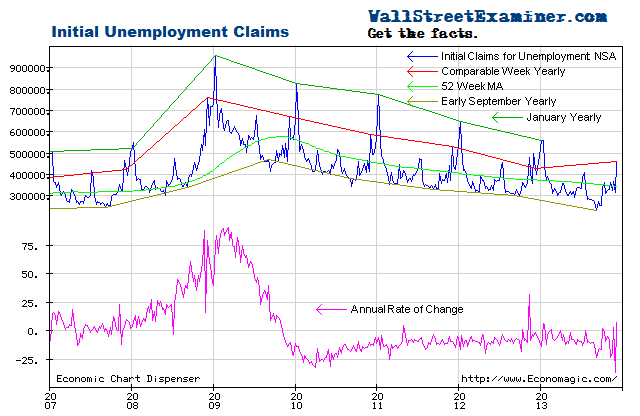
Initial Unemployment Claims – Click to enlarge
There’s significant volatility in this number, with a usual range of zero to -20%. In the second and third quarters, claims as a percentage of the total employed were at levels last seen at the end of the housing bubble, just before the market and economy collapsed. They are now back at that level. In fact, this week’s reading is the lowest for the same week since 1999, which was at the peak of the internet and technology bubble. Initial unemployment claims as a percentage of total employed is at levels last seen at the end of the housing bubble, and the end of the internet/tech bubble. That’s ominous.

Initial Unemployment Claims Percentage of Total Employed – Click to enlarge
The current weekly change in the NSA initial claims number is a decrease of 37,000 (rounded and adjusted for the usual undercount) from the previous week. That compares with a decrease of 75,000 in the post Superstorm Sandy comparable week last year. The big surge in post storm claims was in the prior two weeks last year. The current weekly change compares with the 10 year average for this week of -7,000. The third November reading was down in 7 of the prior 10 years, but the 3 years that increased saw huge increases, skewing the average. The current weekly change is consistent with the change for this week in the 7 years which showed declines. In short, it is a strong, but unremarkable number, consistent with the trend.
Federal withholding tax data published in real time by the Treasury Department slumped sharply in the first half of October during the government shutdown. It has since gradually returned to the trend growth rate of the past year, which supports the view that employment growth remains on trend. I report on this data in greater detail with graphs of the trends in the weekly Professional Edition Treasury update.
Current weekly claims would need to be greater than the comparable week last year to signal a weakening economy. That has not happened. The year to year comparisons are now much tougher than in the early years of the 2009-13 rebound, but the trend rate of change has remained remarkably consistent. With those much tougher comparisons versus the prior year, I would expect some slowing in the rate of improvement to be normal, and not an indication of a weakening economy. But so far it has not happened. It raises the question of whether the economy is overheating in some respects not yet obvious to us.
Relative to the trends indicated by unemployment claims, stocks have been extended and vulnerable since May. QE has pushed stock prices higher as several economic data series show, QE does not seem to influence the trend of the economy.
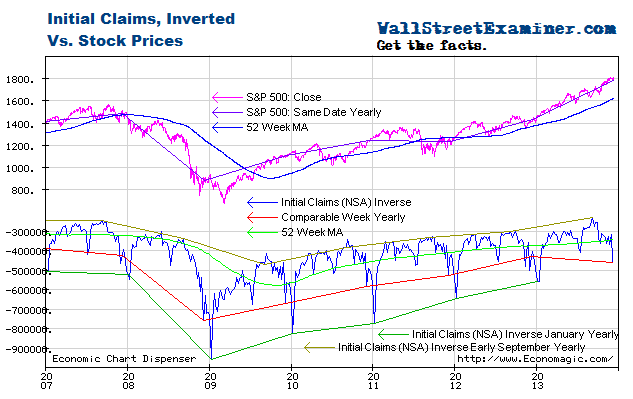
Initial Unemployment Claims and Stock Prices- Click to enlarge
On this chart the claims trend is plotted on an inverse scale with stock prices on a normal scale. The acceleration of stock prices in the first half of 2013 suggested that bubble dynamics were at work in the equities market, thanks to the Fed’s money printing. That appears to be continuing. I address the specific potential outcomes in my proprietary technical research.
Get regular updates on the machinations of the Fed, Treasury, Primary Dealers and foreign central banks in the US market, in the Fed Report in the Professional Edition, Money Liquidity, and Real Estate Package. Click this link to try WSE's Professional Edition risk free for 30 days!
Copyright © 2012 The Wall Street Examiner. All Rights Reserved.
Get regular updates on the machinations of the Fed, Treasury, Primary Dealers and foreign central banks in the Fed Report in the Professional Edition, Money Liquidity, and Real Estate Package. ...
more

