Stagnation Settling In New Home Market
The U.S. new homes market is showing signs of stagnation. That can be seen in the trend for the market capitalization of new homes sold in the U.S., which moved sideways from August to September 2021. The initial estimate of the market cap itself for September 2021 is $29.35 billion.
By this measure, the U.S. new home market last peaked in December 2020 at $30.12 billion. Since then, the market for new homes in the U.S. has shrunk in both real and nominal terms.
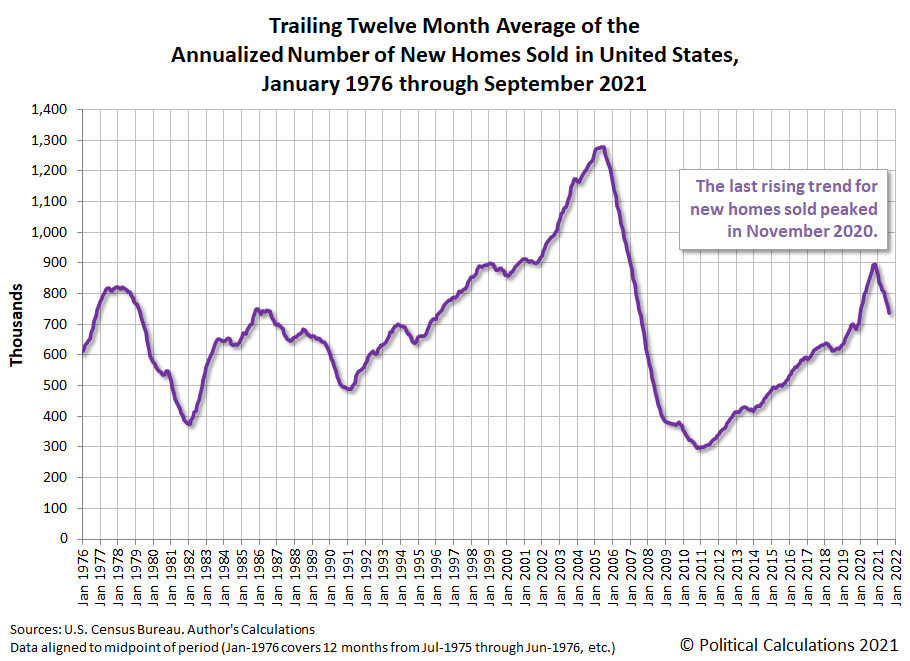
Speaking of real shrinkage, the number of new homes being sold in the U.S. has continued to decline from its November 2020 peak.
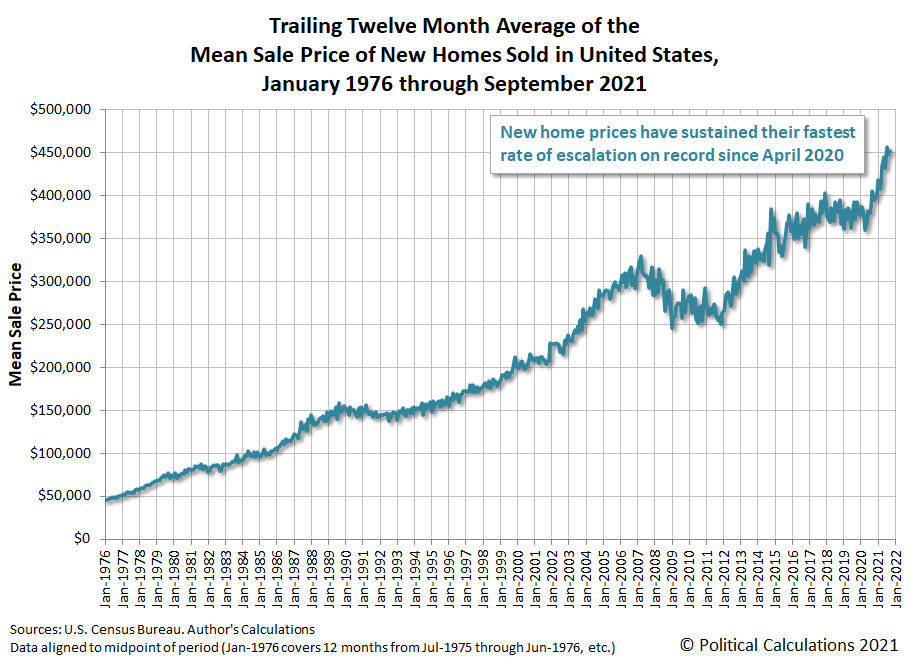
The market cap for new homes however is only managing to tread water because the average prices of new homes sold is escalating at its fastest pace on record.
The new home market has become a source of headwinds for the U.S. economy in 2021.
References
U.S. Census Bureau. New Residential Sales Historical Data. Houses Sold. [Excel Spreadsheet]. Accessed 26 September 2021.
U.S. Census Bureau. New Residential Sales Historical Data. Median and Average Sale Price of Houses Sold. [Excel Spreadsheet]. Accessed 26 September 2021.
Disclaimer: Riki nema disclaimer.
Comments
 No Thumbs up yet!


