
5 Great Mid Caps
Today I sorted the S&P 400 Mid Cap Index to find the stocks with the best technical indicators and charts. First, I sorted for new highs frequency in the last month, then I used the Flipchart feature to review the charts. I skipped over a lot of charts till I found the consistency I liked.
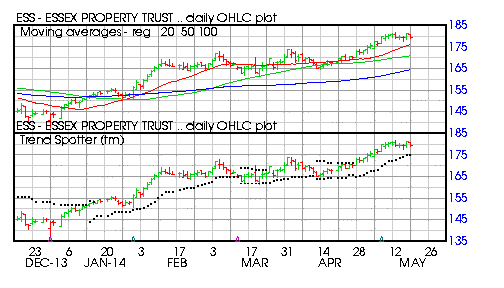
Today list includes Essex Property Trust (ESS), Mid-America Apartment Communities (MAA), Old Dominion Freight Lines (ODFL), Equinix(EQIX), and Omega Healthcare Investors (OHI):
Barchart technical indicators:
- 88% Barchart technical buy signals
- Trend Spotter buy signal
- Above its 20, 50 and 100 day moving averages
- 14 new highs and up 6.78% in the last month
- Relative Strength Index 62.79%
- Barchart computes a technical support level at 178.04
- Recently traded at 179.28 with a 50 day moving average of 170.87
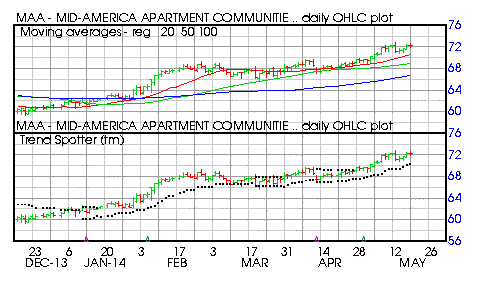
Mid-America Apartment Communities (MAA)
Barchart technical indicators:
- 80% Barchart technical buy signals
- Trend Spotter buy signals
- Above its 20, 50 and 100 day moving averages
- 12 new highs and up 6.13% in the last month
- Relative Strength Index 68.80%
- Barchart computes a technical support level at 71.50
- Recently traded at 72.33 with a 50 day moving average of 68.92
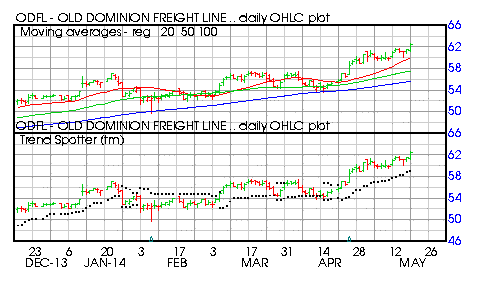
Old Dominion Freight Lines (ODFL)
Barchart technical indicators:
- 96% Barchart technical buy signals
- Trend Spotter buy signal
- Above its 20, 50 and 100 day moving averages
- 12 new highs and up 12.84% in the last month
- Relative Strength Index 71.45%
- Barchart computes a technical support level at 60.72
- Recently traded at 62.40 with a 50 day moving average of 57.51
Barchart technical indicators:
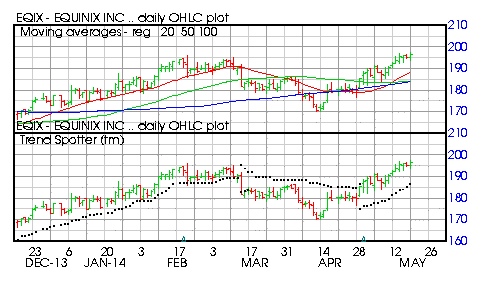
- 96% Barchart technical buy signals
- Trend Spotter buy signal
- Above its 20, 50 and 100 day moving averages
- 12 new highs and up 9.82% in the last month
- Relative Strength Index 70.14%
- Barchart computes a technical support level at 192.30
- Recently traded at 196.55 with a 50 day moving average of 183.96
Omega Healthcare Investors (OHI)
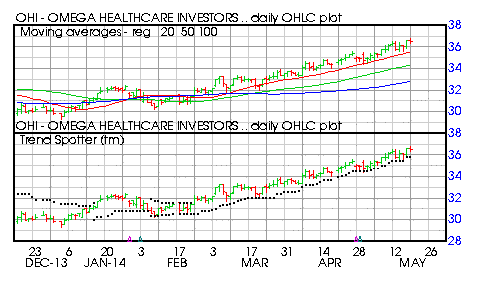
Barchart technical indicators:
- 96% Barchart technical buy signals
- Trend Spotter buy signal
- Above its 20, 50 and 100 day moving averages
- 12 new highs and up 6.17% in the last month
- Relative Strength Index 68.42%
- Barchart computes a technical support level at 36.05%
- Recently traded at 36.50 with a 50 day moving average of 34.33
Disclosure: None
How did you like this article? Let us know so we can better customize your reading experience.

Comments
Leave a comment to automatically be entered into
our contest to win a free Echo Show.

