
Chart Of The Day - LynodellBasell Industries (LYB)
The Chart of the Day is LynodellBasell Industries (LYB). I found the stock by sorting the All Time High list for new high frequency in the last month. I skipped over the stock that didn't have positive gains in the last week and month then used the Flipchart feature to review the charts. Since the Trend Spotter signaled a buy on 2/7 the stock gained 8.15%.
LYB manufactures chemicals and derivatives. It also operates as a refiner of heavy high-sulfur crude oil produce and is engaged in the marketing and selling of polyolefins, polypropylene and polyethylene resins. Their products and technologies are used to make items that improve the quality of life for people around the world including packaging, electronics, automotive components, home furnishings, construction materials and biofuels. The Company's product range includes ethylene, propylene, polyethylene, polypropylene, polyolefins, resins, PP compounds, Polybutene, propylene Oxide and etc. It also produces refined petroleum products and gasoline blending components, including biofuels.
(click to enlarge)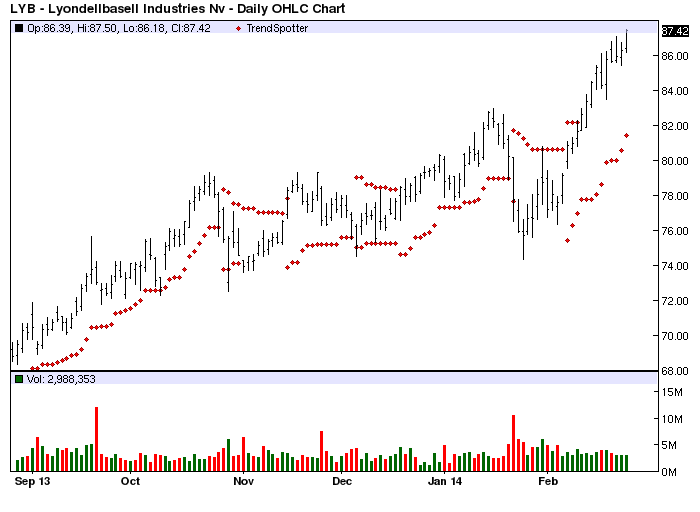
Barchart's Opinion trading systems are listed below. Please note that the Barchart Opinion indicators are updated live during the session every 10 minutes and can therefore change during the day as the market fluctuates. The indicator numbers shown below therefore may not match what you see live on the Barchart.com web site when you read this report.
Barchart technical indicators:
- 96% Barchart technical buy signals
- Trend Spotter buy signal
- Above its 20, 50 and 100 day moving averages
- 17 new highs and up 15.19% in the last month
- Relative Strength Index 73.41%
- Barchart computes a technical support level at 84.82
- Recently traded at 87.42 with a 50 day moving average of 80.24
Fundamental factors:
- Market Cap $48.34 billion
- P/E 12.68
- Dividend yield 2.79%
- Revenue predicted to grow 4.00% this year and 3.70% next year
- Earning estimated to increase 8.40% this year, increase an additional 11.50% next year and continue to increase at an annual rate of 9.73% for the next 5 years
- Wall Street analysts issued 4 strong buy, 11 buy and 4 hold recommendations
- Financial Strength is A
The stock has great momentum and volume as should continue to rise. Watch the 50 day moving average for weakness and exit at the 100 day moving average.
None.


