
International Game Technologies; A Bidding War Is Inevitable
Reuters recently reported that Italian lottery operator GTECH (LTOMF) said on Monday it was in preliminary talks to buy Las Vegas-based slot machine maker International Game Technology (IGT) in a deal that could involve a cash and paper offer. In the article it also mentioned that there were other bidders interested like the Carlyle Group (CG) and Caesars Entertainment (CZR) as well as many private concerns. If each of those contenders want it bad enough, a full scale bidding war could assume after all the bids are tabulated.
Last week I wrote an article for TalkMarkets that explained why I believe that IGT’s stock is extremely oversold and that it could go for as much as $30 a share in a buyout. You can read the article by going here .
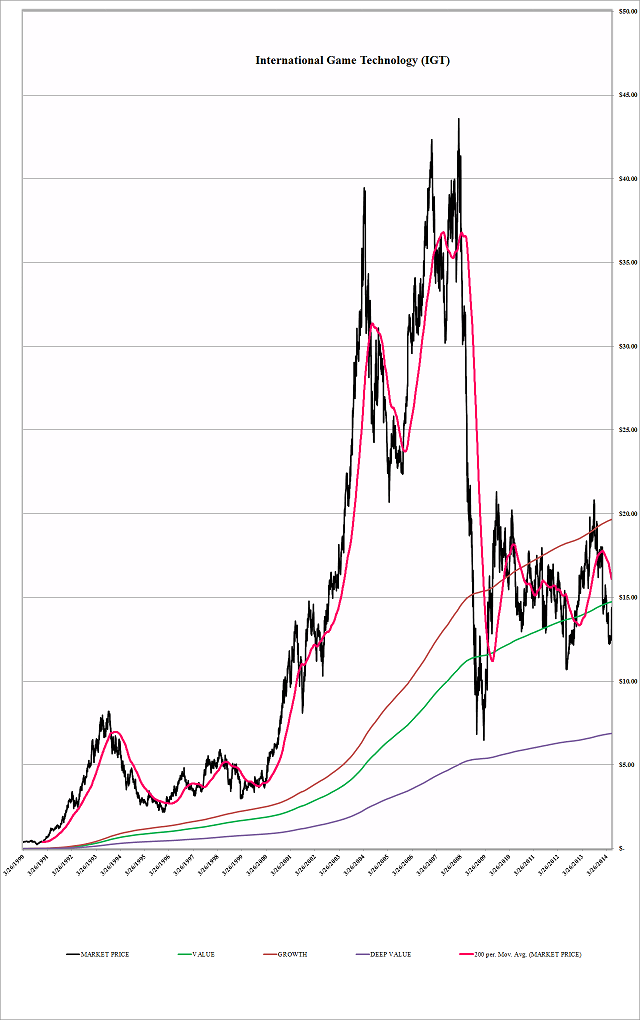
Over the weekend I went and did some additional research on the financials of IGT and I will share them with you now. The great thing about this company is that it is not only trading at historically low levels from a technical analysis long term point of view, as the chart below shows, but it is so attractive to these bidders because it also has an amazing track record as a strong free cash flow generator.
The following is a table showing the free cash flow history for IGT from 1990 to 2013. You will see that it has been a very strong free cash flow generator throughout its history.
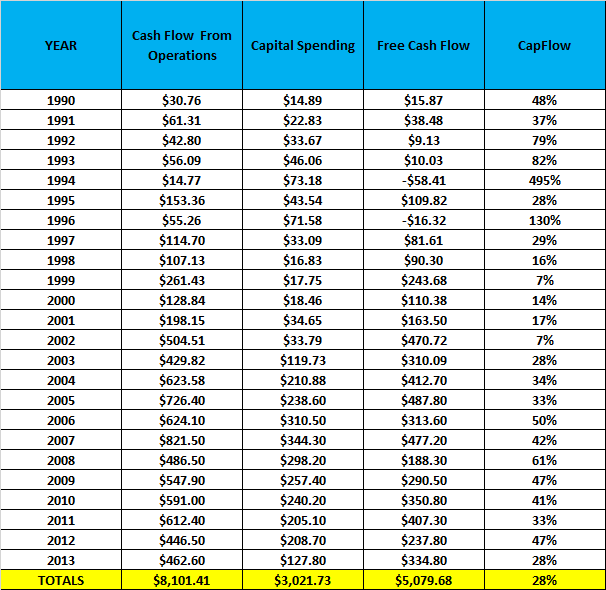
Despite all the recent coverage in the press and the sharp jump in the stock price of IGT in the last week, the entire company’s market capitalization is still only $3.84 billion. Using the table above, if one were to add up all the free cash flow that the company has generated since 1990, you would get a figure of $5.079 billion. When divided by the 247 million shares outstanding, you would then get $20.56 per share as a result of its cumulative free cash flow.
Now the company went public in 1980 and it is almost impossible to get one’s hands on free cash flow from operations data prior to 1990, unless you are willing to spend $20,000 a year in research costs. Since I am not willing to do so, I created a new method of getting a very similar result that just requires one to spend some time in a major University Library that has Microfiche of Value Line. Value Line unfortunately defines free cash flow as:
(Net Income + Depreciation & Amortization) – Capital Spending
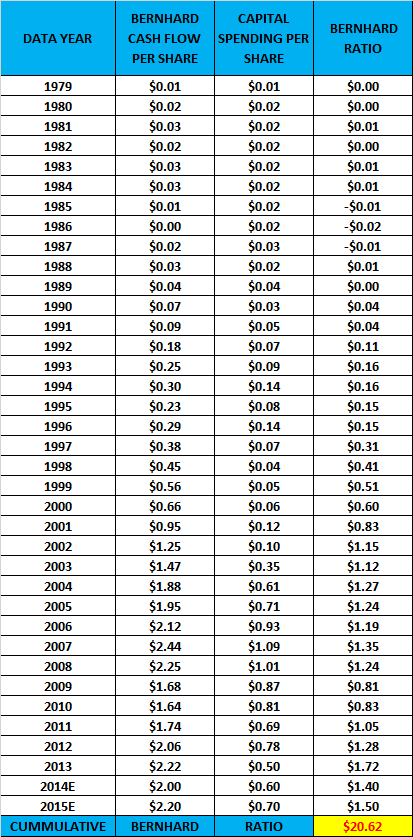
Therefore though it is not as complete as the standard Cash Flow from Operations that you see reported in company’s financial statements, it is almost impossible to get free cash flow data prior to 1990. But with enough leg work one can get Value Line data on most company’s using Value Line’s Microfiche going as far back to 1953 and its all free at an major University Library. What I like to do when analyzing a company is to go back to when it was founded, when I possibly can, and then add up all the free cash flow results per share for each year and then combine them. Since the Value Line result is not really free cash flow in the classic sense, it cannot really be called so, thus I have renamed it the Bernhard Ratio after the founder of Value Line and “Dean of Wall Street” Arnold Bernhard, who did more for the field of Financial Research than any man in history.
Therefore when we go back to 1979, when the company first started operations, we find that when we include forward estimates of the Bernhard Ratio for 2014 & 2015, we come up with a total result of $20.62 per share. Thus we can see that the cumulative Bernhard Ratio in the end is more conservative than our cumulative free cash flow ratio, so though not as perfect, it sure does the job in giving us a complete picture, since the time when IGT was formed.
In going back to the large technical long term technical chart (at the beginning of this article) measuring IGT’s 3650 trading day moving average (13 ½ years), we see that the company is trading below that moving average. But when one divides the price to that average (which is name SIA for Statistical Indicator Analysis) and then go back throughout the company’s history we find that from a long term technical analysis point of view that IGT is trading at its lowest level ever or at an extreme bargain from a Price to SIA point of view as the chart below shows.
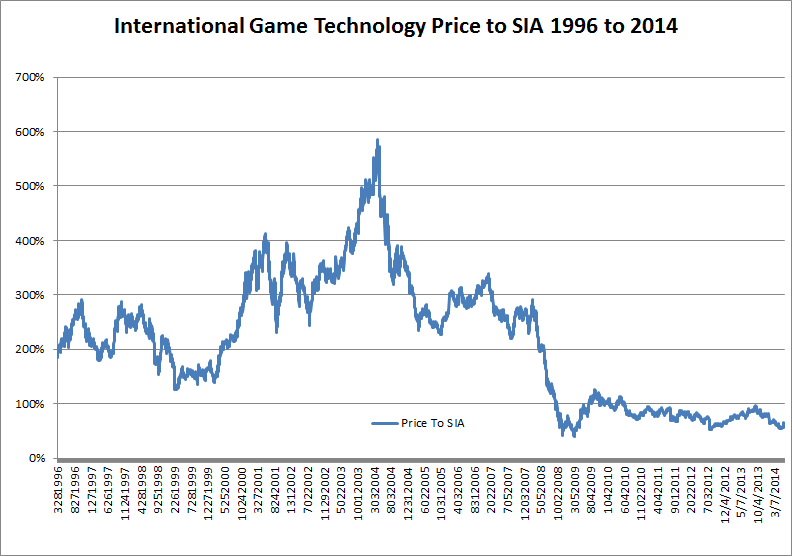
Now the reason why we started the chart in 1996 is because that is the first year that IGT completed its first 3,650 trading days. Whenever you can find a stock trading below its SIA moving average and still have strong free cash flow, you thus have yourself a situation which the so called “efficient market” has completely overlooked.
This system of analysis only works if the company continues to maintain a strong free cash flow or Bernhard Ratio going forward, as companies like Radio Shack (RSH) and Eastman Kodak (KODK) are examples of stocks selling at extreme discounts to their SIA and had amazing cumulative free cash flows, as well as cumulative Bernhard ratios, but were terrible investments as in the years where purchase was considered, they had negative free cash flow and negative Bernhard ratios. This system only works if current year free cash flow results are positive as is the case with IGT. Here is my firm’s research on the company so we can complete the total view of what an extreme bargain IGT is at these levels.
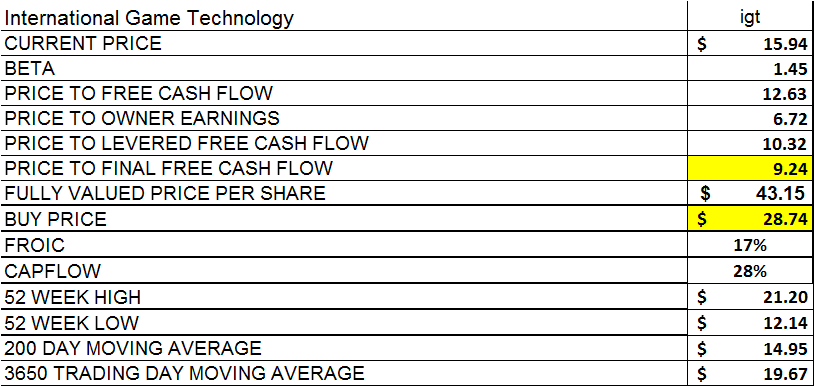
Always remember that these are the results of our research based on the methodology that I have outlined above and in other articles previously published. This research is provided as an ...
more

