
3Q2014 Preliminary: Productivity Up, Costs Down - Or Vice Versa
A simple summary of the headlines for this release is that the growth of labor costs is down from the previous quarter, whilst the rate of growth of productivity is up. If one looks at the year-over-year data - it is saying the opposite is occurring relative to the quarter one year ago.
The market was expecting the headline non-farm productivity improvement of +0.3% to 1.9% (consensus +1.5%) - versus the +2.0% actual. The market was expecting the headline unit labor cost growth of +0.0% to +2.2% (consensus +0.8%) - versus the +0.3% actual.
The headlines annualize quarterly results (Econintersect uses year-over-year change in our analysis). If data is analyzed in year-over-year fashion, productivity was up 0.9% year-over-year, and unit labor costs was up 2.4% year-over-year. Bottom line: the year-over-year data is saying that costs are rising faster than productivity increases.
Although one could argue that productivity improvement must be cost effective, it is not true that all cost improvement are productivity improvements. [read more on this statement] Further, the productivity being measured is "capital productivity" - not "labor productivity". [read more on this statement here]
Even though a decrease in productivity to the BLS could be considered an increase in productivity to an industrial engineer, this methodology does track recessions. [The current levels are well above recession territory.
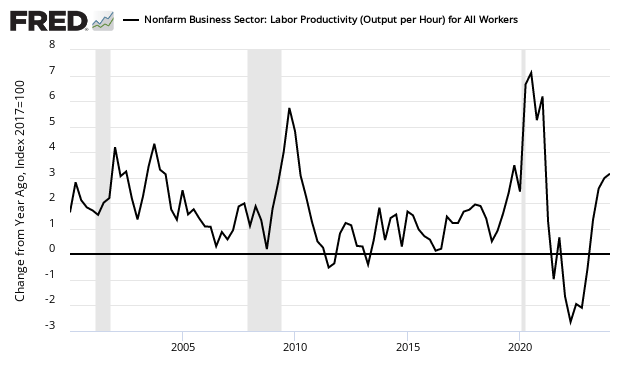
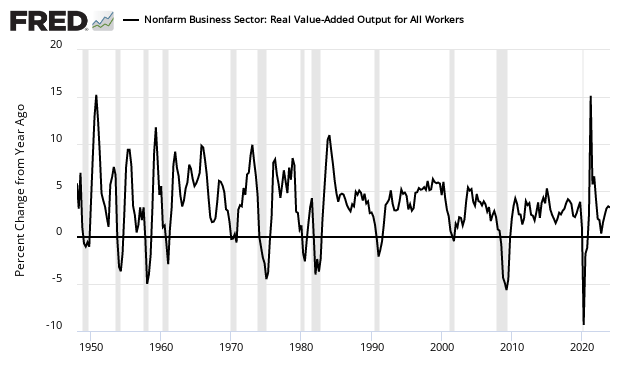
Please note that the following graphs are for a sub-group of the report nonfarm > business. Business sector real productivity is growing slower year-over-year than last quarter (see graph below).
Seasonally Adjusted Year-over-Year Change in Output of Business Sector

And the year-over-year output per person was worse than the last quarter (see graph below).
Seasonally Adjusted Year-over-Year Change of Output per Hour for the Business Sector
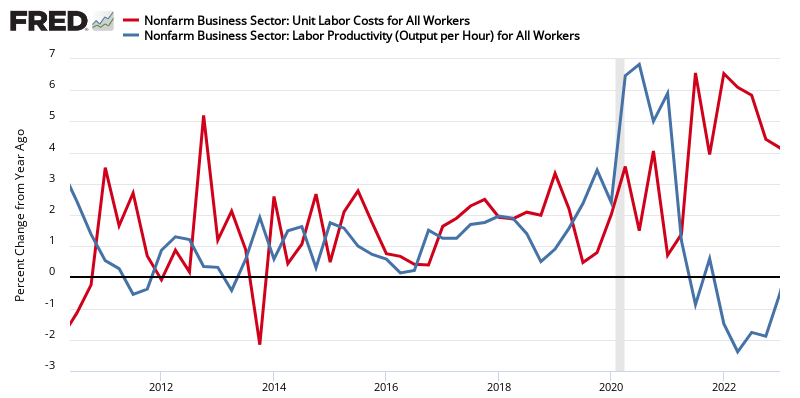
All this is happening while business sector unit labor costs increased - but growth is at a slower rate than last quarter.
Seasonally Adjusted Year-over-Year Rate of Change of Unit Labor Costs
The headlines from the press release:
Nonfarm business sector labor productivity increased at a 2.0 percent annual rate during the third quarter of 2014, the U.S. Bureau of Labor Statistics reported today, as output increased 4.4 percent and hours worked increased 2.3 percent. (All quarterly percent changes in this release are seasonally adjusted annual rates.) From the third quarter of 2013 to the third quarter of 2014, productivity rose 0.9 percent as output and hours worked increased 3.0 percent and 2.1 percent, respectively. (See chart 1 and table A.)
Labor productivity, or output per hour, is calculated by dividing an index of real output by an index of hours worked of all persons, including employees, proprietors, and unpaid family workers.
Unit labor costs in the nonfarm business sector rose 0.3 percent in the third quarter of 2014, as a 2.3 percent increase in hourly compensation was larger than the 2.0 percent increase in productivity. Unit labor costs increased 2.4 percent over the last four quarters.
BLS defines unit labor costs as the ratio of hourly compensation to labor productivity; increases in hourly compensation tend to increase unit labor costs and increases in output per hour tend to reduce them.
Manufacturing sector productivity increased 3.2 percent in the third quarter of 2014, as output increased 4.1 percent and hours worked increased 0.8 percent. In the durable goods manufacturing sector, productivity grew 4.2 percent, reflecting a 6.6 percent increase in output and a 2.3 percent increase in hours. In nondurable goods industries, productivity grew 3.0 percent, as output increased 1.2 percent and hours worked fell 1.8 percent. (See tables A, 3, 4, and 5.) Over the last four quarters, manufacturing productivity increased 2.8 percent, as output increased 4.4 percent and hours increased 1.5 percent. Unit labor costs in manufacturing decreased 0.7 percent in the third quarter of 2014 and increased 0.6 percent from the same quarter a year ago.
preliminary chart:

Caveats Relating to Productivity
Productivity is determined using monetary criteria, and does not recognize outsourced man hours – in other words, if a business cuts half of its workforce by outsourcing a sub-component or sub-service, this would be a 50% productivity improvement.
These productivity measures describe the relationship between real output and the labor time involved in its production. They show the changes from period to period in the amount of goods and services produced per hour. Although these measures relate output to hours at work of all persons engaged in a sector, they do not measure the specific contribution of labor, capital, or any other factor of production. Rather, they reflect the joint effects of many influences, including changes in technology; capital investment; level of output; utilization of capacity, energy, and materials; the organization of production; managerial skill; and the characteristics and effort of the work force.
Econintersect believes a better measure (if you must use monetary tools to tract productivity) would be competitiveness.
Looking at productivity / output long term – output fall below 0% year-over-year change is a good sign that a recession is underway. Another way to look at it – if productivity rate of gain is falling, this could be an indicator a recession is coming.
Disclosure: None.


