
5 Mid Caps Bucking The Trend
As I write this post the S&P 400 Mid Cap Index is in a downward trend with 88.95% of the stocks trading below their 20 day moving averages. The Index is 6.87% off its previous high and trending lower.
There are 5 stocks that are swimming against the tide. I found them using Barchart to sort the Index first for the best technical buy signals, then I used the Fipchart feature to find 5 charts I like.
Today's list includes:
Panera Bread (NASDAQ:PNRA),
Hanesbrands (NYSE:HBI),
Brinker International (NYSE:EAT) and
Mallincrkrodt PLC (NYSE:MNK):
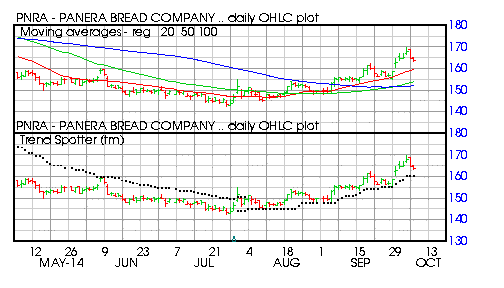
Barchart technical indicators:
- 96% Barchart technical buy signals
- Trend Spotter buy signal
- Above its 20, 50 and 100 day moving averages
- 9 new highs and up 5.40% in the last month
- Relative Strength Index 62.22%
- Barchart computes a technical support level at 161.57
- Recently traded at 164.08 with a 50 day moving average of 153.82
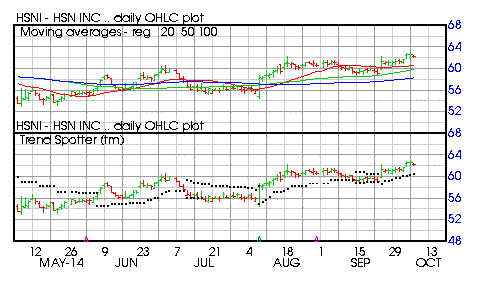
Barchart technical indicators:
- 96% Barchart technical buy signals
- Trend Spotter buy signal
- Above its 20, 50 and 100 day moving averages
- 4 new highs and up 576% in the last month
- Relative Strength Index 62.59%
- Barchart computes a technical support level at 61.34%
- Recently traded at 62.34 with a 50 day moving average of 59.82
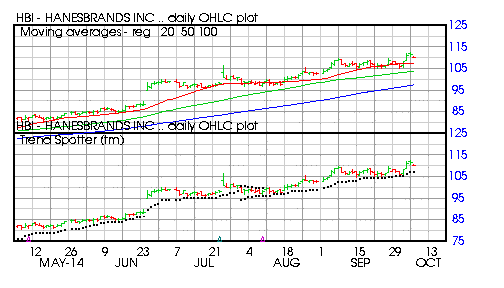
Barchart technical indicators:
- 96% Barchart technical buy signals
- Trend Spotter buy signal
- Above its 20, 50 and 100 day moving averages
- 3 new highs and up 1.55% in the last month
- Relative Strength Index 61.85%
- Barchart computes a technical support level at 109.72
- Recently traded at 110.37 with a 50 day moving average of 103.80
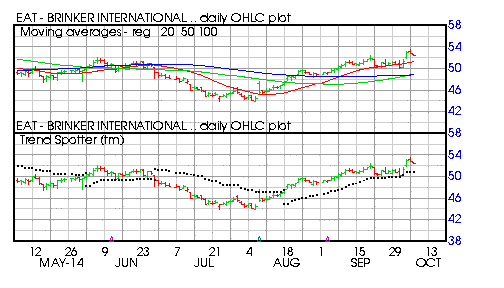
Barchart technical indicators:
- 96% Barchart technical buy signals
- Trend Spotter buy signal
- Above its 20, 50 and 100 day moving averages
- 9 new highs and up 490% in the last month
- Relative Strength Index 62.62%
- Barchart computes a technical support level at 52.29
- Recently traded at 52.54 with a 50 day moving average of 48.98
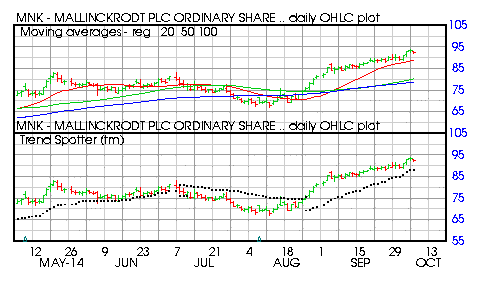
Barchart technical indicators:
- 88% Barchart technical buy signals
- Trend Spotter buy signal
- Above its 20, 50 and 100 day moving averages
- 14 new highs and up 9.17% in the last month
- Relative Strength Index 70.22%
- Barchart computes a technical support level at 91.78
- Recently traded at 92.00 with a 50 day moving average of 80.24
Disclosure: None
How did you like this article? Let us know so we can better customize your reading experience.

Comments
Leave a comment to automatically be entered into
our contest to win a free Echo Show.

