
5 Solid Large Caps
The whole market including the large cap stocks have taken a hit recently. As I write this post the majority of the S&P 500 Large Cap Index stocks are trading below their moving averages:
- Only 17.20% are trading above their 20 day moving averages
- Only 22.00% are trading above their 50 day moving averages
- Only 38.40% are trading above their 100 day moving averages
Not a great sign of market confidence is it?
This morning I used Barchart to sort the S&P 500 Large Cap Index stock for the 5 with the best technical buy signals and then used the Flipchart feature to find the charts I liked. The 5 that are include in today's Van Meerten Stock Picks list are Pepsico (NYSE:PEP), Kroger (NYSE:KR),Coca-Cola (NYSE:KO), Duke Energy (NYSE:DUK) and Costco Wholesale (NASDAQ:COST):
Pepsico (PEP)
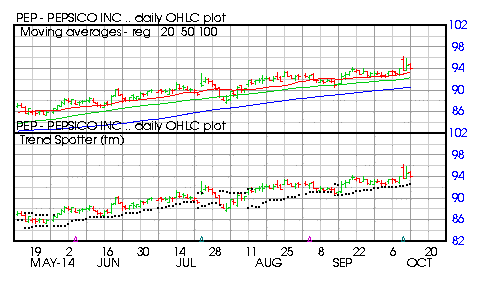
Barchart technical indicators:
- 100% Barchart technical buy signals
- Trend Spotter buy signal
- Above its 20, 50 and 100 day moving averages
- 6 new highs and up 3.12% in the last month
- Relative Strength Index 63.67%
- Barchart computes a technical support level at 92.50
- Recently traded at 94.75 with a 50 day moving average of 92.17
Kroger (KR)
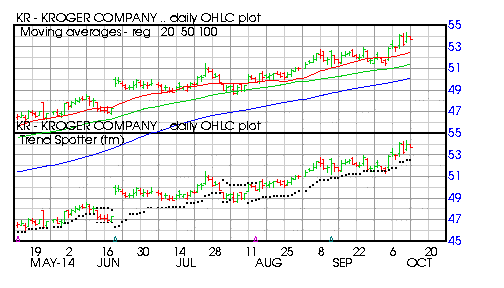
Barchart technical indicators:
- 100% Barchart technical buy signals
- Trend Spotter buy signal
- Above its 20, 50 and 100 day moving averages
- 7 new highs and up 3.95% in the last month
- Relative Strength Index 64.55%
- Barchart computes a technical support level at 53.00
- Recently traded at 53.95 with a 50 day moving average of 51.32
Coca-Cola (KO)
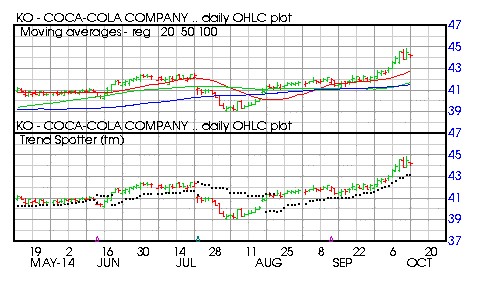
Barchart technical indicators:
- 100% Barchart technical buy signals
- Trend Spotter buy signal
- Above its 20, 50 and 100 day moving averages
- 11 new highs and up 5.45% in the last month
- Relative Strength Index 71.09%
- Barchart computes a technical support level at 43.38
- Recently traded at 44.42 with a 50 day moving average of 41.61
Duke Energy (DUK)
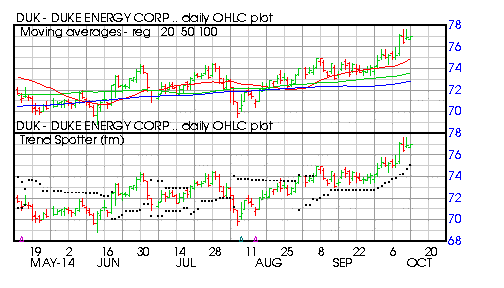
Barchart technical indicators:
- 100% Barchart technical buy signals
- Trend Spotter buy signal
- Above its 20, 50 and 100 day moving averages
- 9 new highs and up 4.69% in the last month
- Relative Strength Index 66.30%
- Barchart computes a technical support level at 76.18
- Recently traded at 77.55 with a 50 day moving average of 73.51
Costco Wholesale (COST)
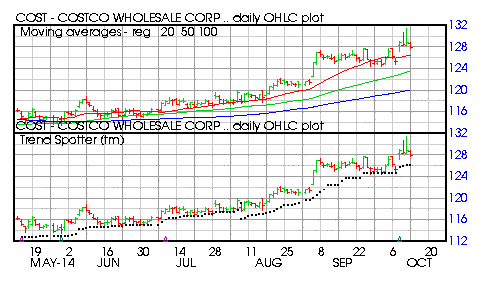
Barchart technical indicators:
- 100% Barchart technical buy signals
- Trend Spotter buy signal
- Above its 20, 50 and 100 day moving averages
- 9 new highs and up 2.16% in the last month
- Relative Strength Index 64.64%
- Barchart computes a technical support level at 126.37
Recently traded at 127.92 with a 50 day moving average of 123.35
Disclosure: None


