
ADRs Best & Worst Report
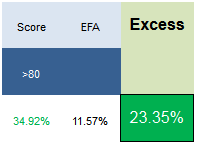
Our top scoring ADRs from one year ago (8/19/2013) have outpaced the EFA by 2,335 bps in the past year. Returns have been led by SHPG up 116%, NOK up 100%, BMA up 86%, and BIDU up 62%.
ADRs Best & Worst Report
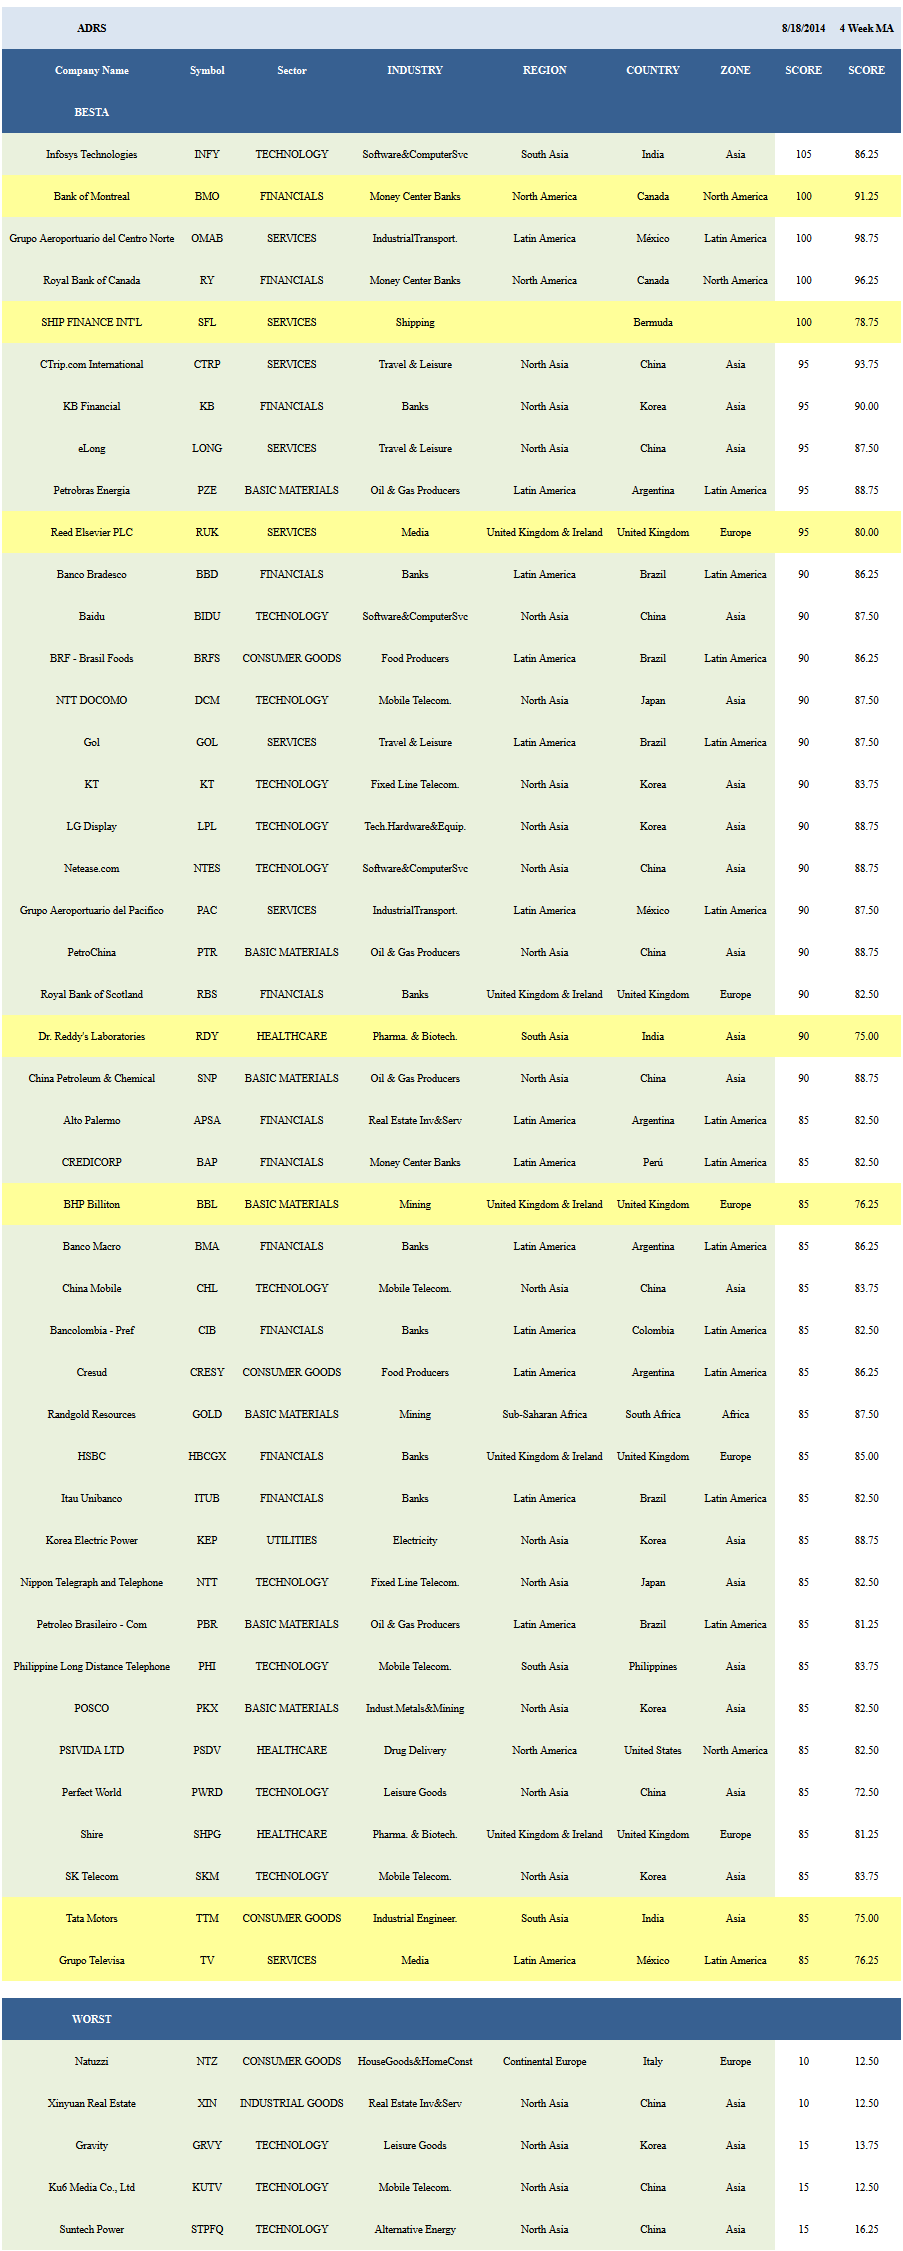
The average ADR score is 57.31 this week, above the four week moving average score of 55.84. The average ADR is trading -17.04% below its 52 week high, 0.83% above its 200 dma, has 4.26 days to cover held short, and is expected to post EPS growth of 17.89% next year.

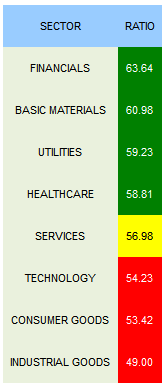
The top scoring ADR sector is financials. Basics (PZE, SNP, PTR, PKX, PBR, GOLD, BBL, YPF, CEO, ACH), utilities (KEP, EDN, HNP, ELP), and healthcare (RDY, SHPG, PSDV, WX, LUX, FLML) also score above the average universe score. Services score in line. Technology, consumer goods, and industrial goods score below average.
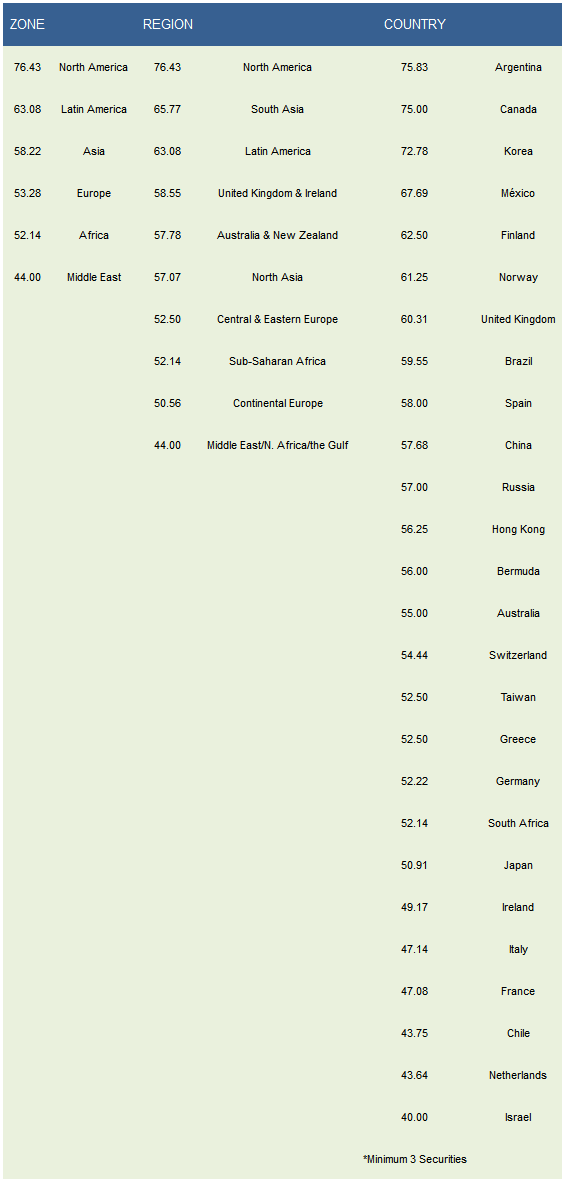
The top scoring zone is North America/Canada (RY, BMO, PSDV, BCE). Latin America (OMAB, PZE, PAC, GOL, BBD, BRFS, TV, ITUB, CIB, BMA, BAP, APSA, CRESY, PBR) is also high scoring. The best regions are North America, South Asia (INFY, RDY, PHI, TTM, IBN, TLK, HDB), and Latin America. Argentina (PZE, BMA, APSA, CRESY, IRS, YPF), Canada (RY, BMO, BCE), Korea (KB, LPL, KT, KEP, SKM, PKX), and Mexico (OMAB, PAC, TV, ASR) are the highest scoring countries.
Disclosure: None.


