
ADR's Best And Worst Report
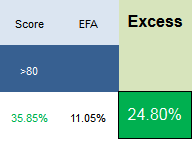
Our top scoring ADRs from one year ago (8/5/2013) have outpaced the EFA by 2,480 bps in the past year. Returns have been led by SHPG up 125%, YPF up 107%, NOK up 100%, and BIDU up 59%.
ADRs Best & Worst Report
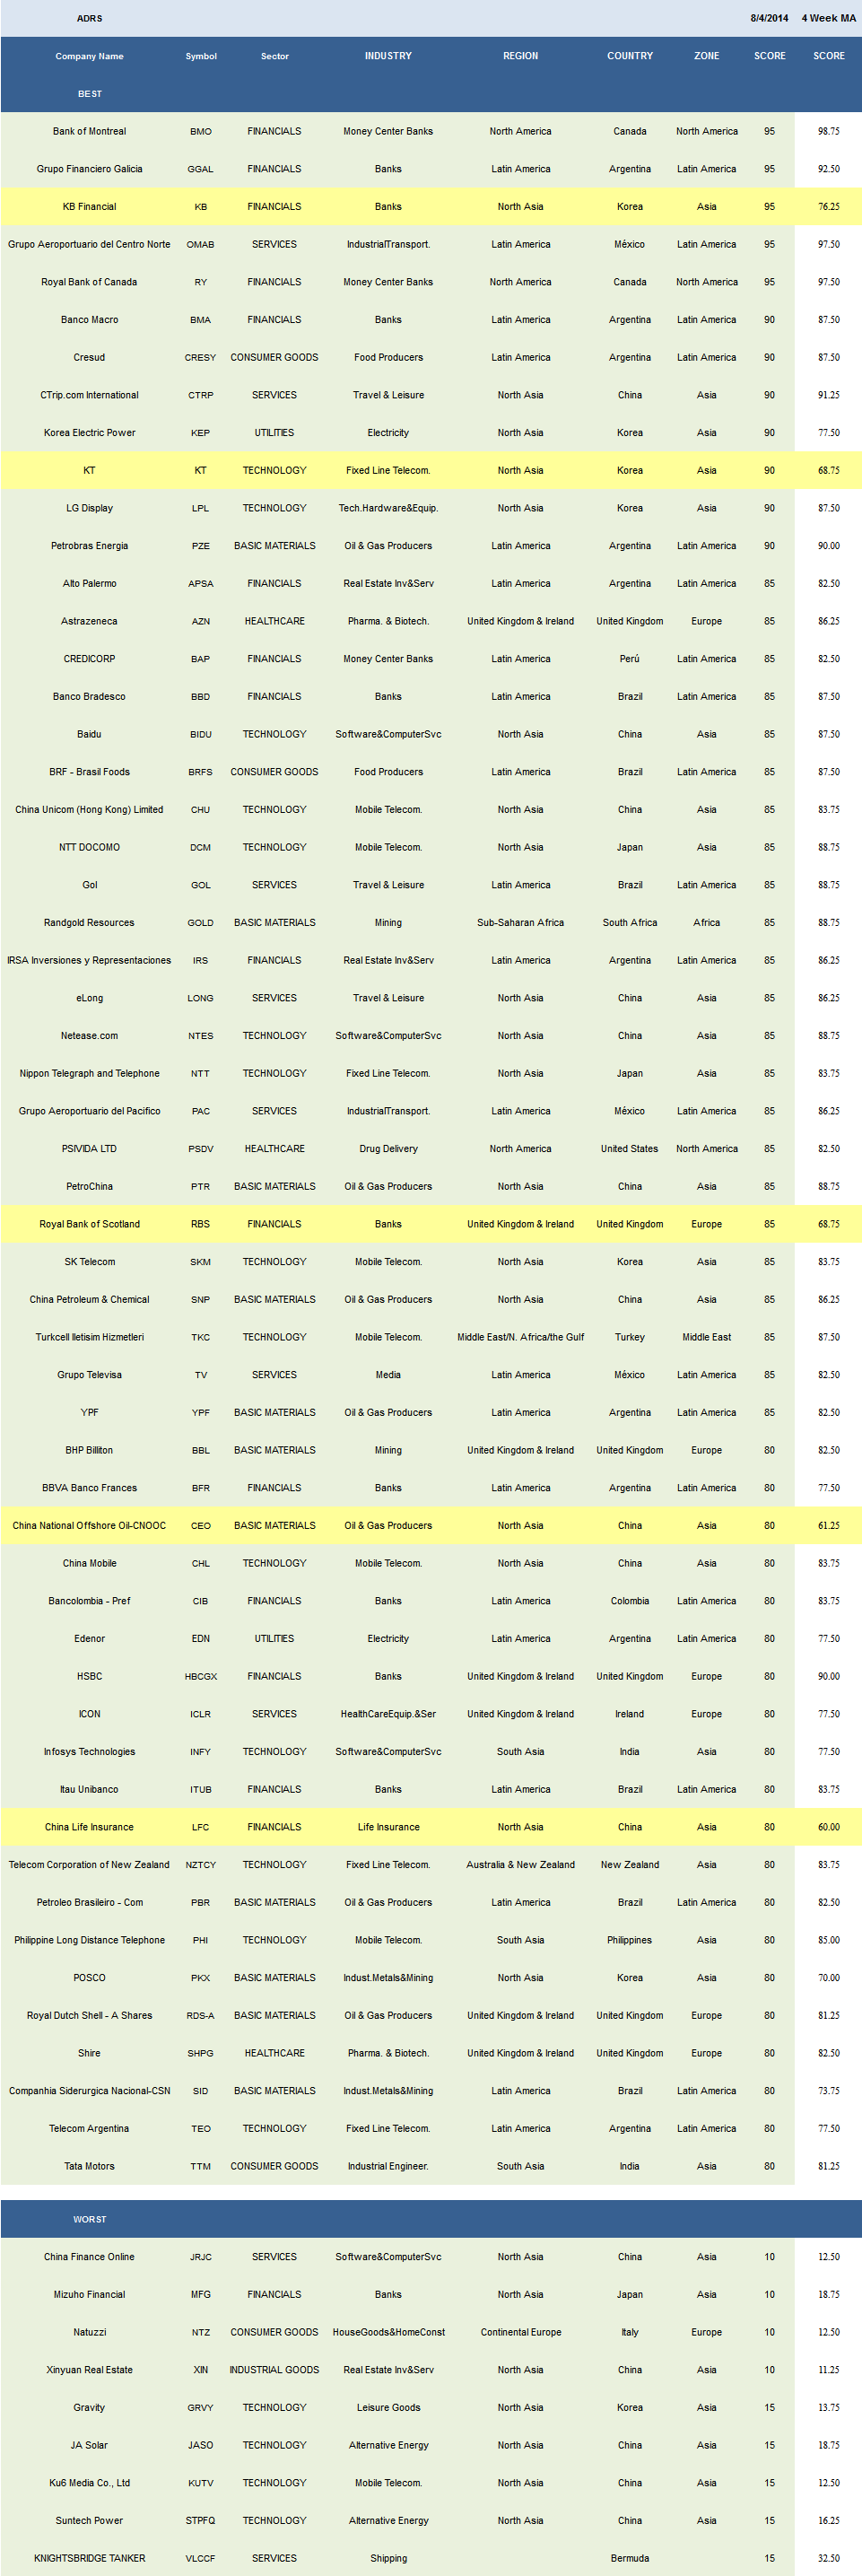
The average ADR score is 54.91 this week, below the four week moving average score of 56.81. The average ADR is trading -17.26% below its 52 week high, 0.69% above its 200 dma, has 4.26 days to cover held short, and is expected to grow EPS by 19.85% next year.
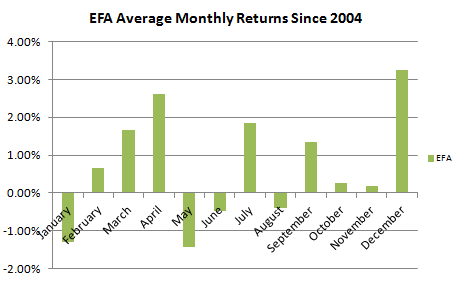
Historically, managers increasing exposure to the MSCI EAFE through August have been rewarded through year end.
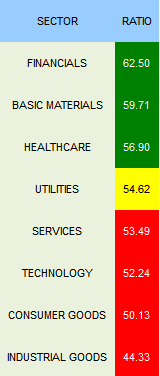
Financials (RY, KB, GGAL, BMO, BMA, RBS, IRS, BBD, BAP, APSA) are the top scoring sector across our ADR universe. Basic materials (PZE, YPF, SNP, PTR, GOLD, SID, RDSA, PKX, PBR, CEO) and healthcare (PSDV, AZN, SHPG, SNN) also score above average. Utilities score in line with the ADR universe average score. Services, technology, consumer goods, and industrial goods score below average.
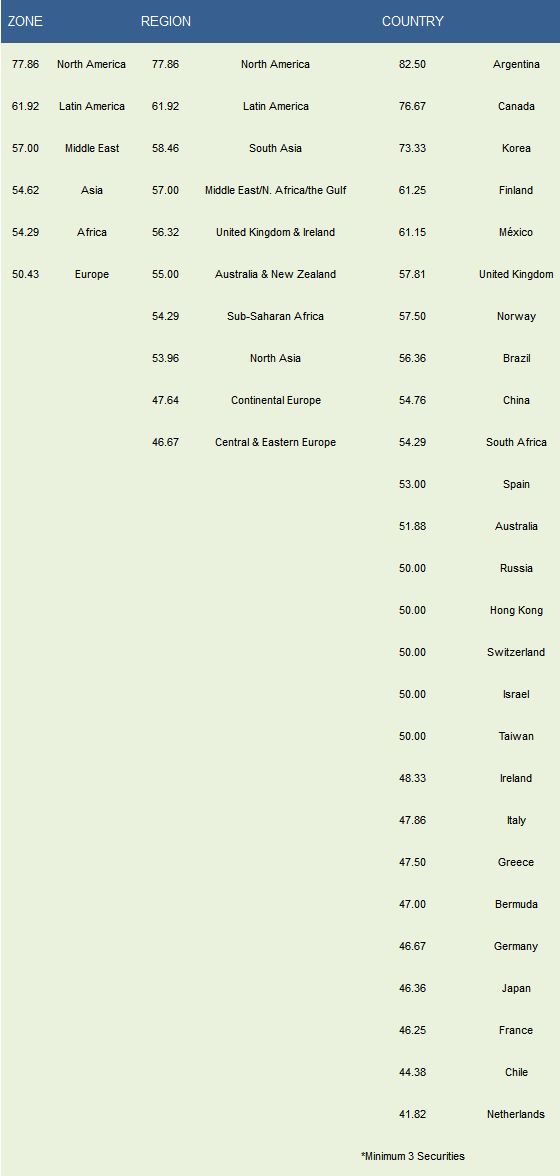
The best scoring zone is North America/Canada (RY, BMO, PSDV, CNQ), followed by LatAm (OMAB, GGAL, BMA, CRESY, PZE, TV, PAC, GOL). North America, LatAm, and South Asia (TTM, INFY, PHI, IBN) are the top regions. The best scoring countries include Argentina (GGAL, BMA, CRESY, PZE, IRS, APSA, YPF), Canada (RY, BMO, CNQ), Korea (KB, KEP, LPL, KT), Finland (MXCYY, NOK), and Mexico (OMAB, TV, PAC, GMK, SIM).
Disclosure: None.


