
Advance Estimate 1Q2014 GDP Growth Real Ugly At 0.1%

The advance estimate of first quarter 2014 Real Gross Domestic Product (GDP) is a positive 0.1%.
- The market expected GDP at +0.5% to 2.0% (consensus 1.1%).
- This data point was 2.6% in 4Q2014.
This advance estimate released today is based on source data that are incomplete or subject to further revision. (See caveats below.) Please note that historically advance estimates have turned out to be little more than wild guesses.
Real GDP is inflation adjusted and annualized – the economy is both expanding in cumulative and on a per capita basis.
Real GDP per Capita

The table below compares the 4Q2013 third estimate of GDP (Table 1.1.2) with the advance estimate 1Q2014 GDP which shows:
- consumption for services has improved;
- trade balance is much worse;
- there was an inventory decline;
- fixed investment has declined;
- government is only a small drag drag on GDP.
The arrows in the table below highlight significant differences between 4Q2013 and 1Q2014 (green is good influence, and red is a negative influence).
[click on graphic below to enlarge]

What the BEA says about the advance estimate of 1Q2014 GDP:
The increase in real GDP in the first quarter primarily reflected a positive contribution from personal consumption expenditures (PCE) that was partly offset by negative contributions from exports, private inventory investment, nonresidential fixed investment, residential fixed investment, and state and local government spending. Imports, which are a subtraction in the calculation of GDP, decreased.
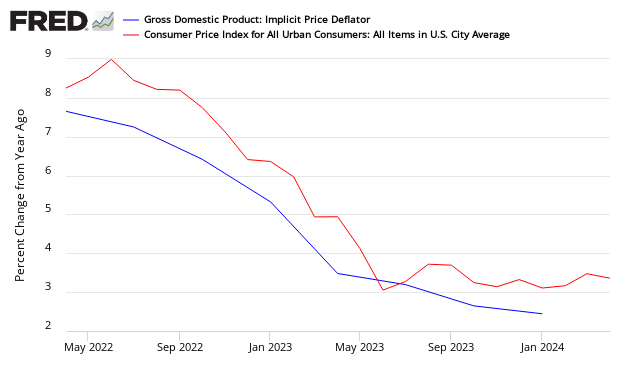
Inflation continues to moderate as the “deflator” which adjusts the current value GDP to a “real” comparable value continues to moderate. The market expected the deflator at 1.4% to 2.5% (consensus 1.7%) versus the reported 1.4%. The following compares the GDP deflator to the Consumer Price Index:
Overview Analysis:
Here is a look at GDP since Q2 1947 together with the real (inflation-adjusted) S&P Composite. The start date is when the BEA began reporting GDP on a quarterly basis. Prior to 1947, GDP was reported annually. To be more precise, what the lower half of the chart shows is the percent change from the preceding period in Real (inflation-adjusted) Gross Domestic Product. I’ve also included recessions, which are determined by the National Bureau of Economic Research (NBER).

Here is a close-up of GDP alone with a line to illustrate the 3.3 average (arithmetic mean) for the quarterly series since the 1947. I've also plotted the 10-year moving average, currently at 1.6 percent, down from 1.7 percent last quarter.
Here is the same chart with a linear regression that illustrates the gradual decline in GDP over this timeframe.
Perhaps the most telling representation of slowing growth in the US economy is the year-over-year rate of change. The latest data point at 2.33 percent is off its interim low of 1.32 percent in Q1 of last year.
And for a bit of political trivia, here is a look at GDP by party in control of the White House and Congress.

In summary, the Q1 GDP Advance Estimate of 0.1 percent was well below most forecasts. On May 29th we'll get the Second Estimate, which often varies significantly from the Advance Estimate.
The chart below is a way to visualize real GDP change since 2007. The chart uses a stacked column chart to segment the four major components of GDP with a dashed line overlay to show the sum of the four, which is real GDP itself. As the analysis clear shows, personal consumption is key factor in GDP mathematics.

Caveats on the Use of Gross Domestic Product (GDP)
GDP is market value of all final goods and services produced within the USA where money is used in the transaction – and it is expressed as an annualized number. GDP = private consumption + gross investment + government spending + (exports − imports), or GDP = C + I + G + (X – M). GDP counts monetary expenditures. It is designed to count value added so that goods are not counted over and over as they move through the manufacture – wholesale – retail chain.
The vernacular relating to the different GDP releases:
“Advance” estimates, based on source data that are incomplete or subject to further revision by the source agency, are released near the end of the first month after the end of the quarter; as more detailed and more comprehensive data become available, “second” and “third” estimates are released near the end of the second and third months, respectively. The “latest” estimates reflect the results of both annual and comprehensive revisions.
Consider that GDP includes the costs of suing your neighbor or McDonald’s for hot coffee spilled in your crotch, plastic surgery or cancer treatment, buying a new aircraft carrier for the military, or even the replacement of your house if it burns down – yet little of these activities is real economic growth.
GDP does not include include home costs (other than the new home purchase price even though mortgaged up the kazoo), interest rates, bank charges, or the money spent buying anything used.
It does not measure wealth, disposable income, or employment.
In short, GDP does not measure the change of the economic environment for Joe Sixpack in 1970, and Joe Sixpack’s kid, yet pundits continuously compare GDP across time periods.
Although there always will be some correlation between all economic pulse points, GDP does not measure the economic elements that directly impact the quality of life of its citizens.
No content is to be construed as investment advise and all content is provided for informational purposes only. The reader is solely responsible for determining whether any investment, security ...
more
Comments
 No Thumbs up yet!

