
Analyzing Performance Histories That Might Have Been
The trend in recent years of securitizing more of the world’s market betas offers investors, in theory, better odds for enhancing risk-adjusted returns. Providing access to a broader set of low and even negatively correlated assets moves us closer to the ideal of building optimal portfolios. In practice, however, juicing results is messy. One challenge is the grey area of developing reasonable expectations for relatively “new” betas that come down the pike. Tapping into a previously obscure market via an ETF, for instance, can be a good thing, but sometimes it’s unclear what to expect due to limited historical data. For some folks, that’s a reason to steer clear. But playing it safe comes with its own set of risks. The question, then, is how does one develop a comfort level with new products that don’t have a long track record as investable portfolios? The short answer: carefully, methodically, and with several techniques, including a bit of statistical modeling.
As an example, let’s say that you’re considering adding emerging market bonds to your portfolio. As an academic exercise, imagine that you’re reviewing the Market Vectors Emerging Markets Local Currency Bond ETF (EMLC), which was launched in July 2010. The fund, which has several competitors, is a gateway to an intriguing corner of the capital markets, but a corner that suffers from a limited record of products with real-world investment results. EMLC’s history is a short four years, and that’s about par for the course when it comes to index funds in this fixed-income realm.
How might we overcome the hurdle to study this slice of the bond market and make an informed decision? We could start by looking to underlying indexes. ETFs are a relatively recent arrival in the land of emerging market debt, but a handful of benchmarks—the J.P. Morgan Emerging Market Bonds Index, for example—have longer track records, albeit records that don’t reflect real-world investing. Indexes, after all, exist only on paper and so they’re free of all the frictions that bedevil ETFs, mutual funds, etc.
As a more practical focus, we could also study actively managed funds that have been toiling in these waters. The T. Rowe Price Emerging Markets Bond (PREMX), for instance, has been around for 20 years. The longer history of this mutual fund gives us something to chew on, but this is only a partial solution at best since it’s an actively run portfolio. As such, any conclusions we draw have limited application for analyzing beta and developing some intuition about what to expect with an indexing strategy.
A third leg of this stool for making the most of EMLC’s short history is deploying a statistical technique called bootstrapping. The idea here is taking a limited performance history and resampling it multiple times, in different orders from the actual record, and using the numbers to simulate a spectrum of possible alternative outcomes for the fund. Although there are caveats, bootstrapping is a useful tool to test a short data set by reshuffling the returns x times.
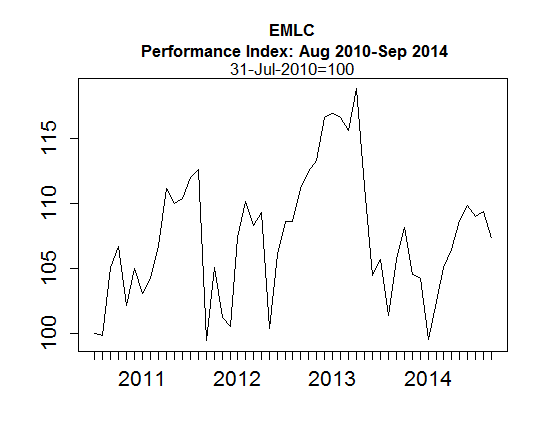
As a brief example, let’s begin by reviewing EMLC’s record thus far by way of monthly performance, based on indexing the fund to 100 as of July 31, 2010. (All the analytics and graphics that follow, by the way, were generated in R.) Although this is the actual record for EMLC, we might think of it as one sample out of thousands. It just happens to be the historical sample, but the figures provide the raw material for creating a rainbow of alternative histories that might have been. Why would we go down the road of simulating alternative track records? For a simple reason: it’s hard to tell much from the existing run of four years of data and so we need to look beyond history as presented.
That said, the historical sample shouldn’t be dismissed entirely. As a clue about risk, there’s some value here. For instance, here’s how EMLC’s limited performance record stacks up from the view of the distribution of returns. Clearly, no one will confuse the record so far as following a normal distribution (red line). The risk of fat tails—relatively large short-term losses—appears to be considerable.

Here’s another way to compare the actual returns (black circles) vs. a normal distribution, i.e., completely random and unpredictable results (red line). If EMLC’s monthly returns were perfectly normal, they’d run along the red line in the quantile plot below. In fact, we can see the fat-tails phenomenon quite clearly, as shown in the lower left-hand corner of the chart: the black circles at the extreme fall well below the red line. By comparison, the circles in the upper right-hand corner are closer to a random distribution, albeit based on limited data.

For obvious reasons, EMLC’s short history creates a challenge for developing a deeper level of insight about the asset class. One way around this problem is bootstrapping the existing data set to create substantially longer track records. For instance, the next chart shows the results of bootstrapping EMLC’s four-year history into a 20-year run. Yes, it’s a simulation, but it’s drawn from EMLC’s actual data and so it provides some insight on what to expect.

The problem, of course, is that one bootstrapping example is a grain of sand on the beach. Accordingly, let’s consider a broad set of possible outcomes. If we were seriously analyzing EMLC, it would be appropriate to simulate tens of thousands, even a million, portfolios that could have been. To illustrate the concept graphically, however, let’s restrict the run to 100 samples, as shown in the next chart below.
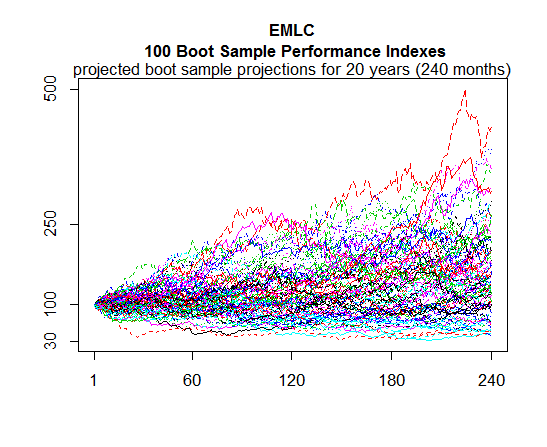
In our simple example, the performance of the 100 simulated portfolios range from strong gains to a 70% loss! Clearly, there’s a wide range of possibilities implied by EMLC’s four-year record when extrapolating the record into the future. As another example, we might take the median of these portfolios as a proxy for EMLC on an ex ante basis and run stress tests via drawdown analysis and how the median result compares with an existing portfolio’s expected profile.
Overall, bootstrapping is one technique that effectively gives us more data to review. Bootstrapping alone isn’t going to answer all our questions in the absence of a long and rich data set. But as one tool for filling in the blank spaces, it’s a powerful resource for considering what’s possible… and what’s not.
Disclosure: None.

Comments
 No Thumbs up yet!

