
Best & Worst ETFs & Mutual Funds: Industrials Sector
The Industrials sector ranks second out of the ten sectors as detailed in my Sector Rankings for ETFs and Mutual Funds report. It gets my Neutral rating, which is based on aggregation of ratings of 19 ETFs and 18 mutual funds in the Industrials sector as of July 15, 2014. Prior reports on the best & worst ETFs and mutual funds in every sector arehere.
Figures 1 and 2 show the five best and worst-rated ETFs and mutual funds in the sector. Not all Industrials sector ETFs and mutual funds are created the same. The number of holdings varies widely (from 20 to 355). This variation creates drastically different investment implications and, therefore, ratings. The best ETFs and mutual funds allocate more value to Attractive-or-better-rated stocks than the worst ETFs and mutual funds, which allocate too much value to Neutral-or-worse-rated stocks.
To identify the best and avoid the worst ETFs and mutual funds within the Industrials sector, investors need a predictive rating based on (1) the stocks ratings of the holdings, (2) the all-in expenses of each ETF and mutual fund, and (3) the fund’s rank compared to all other ETFs and mutual funds. As a result, only the cheapest funds with the best holdings receive Attractive or better ratings. Investors need not rely on backward-looking ratings. My fund rating methodology is detailed here.
Investors seeking exposure to the Industrials sector should buy one of the Attractive-or-better rated ETFs or mutual funds from Figures 1 and 2.
Get my ratings on all ETFs and mutual funds in this sector on my free mutual fund and ETF screener.
Figure 1: ETFs with the Best & Worst Ratings – Top 5
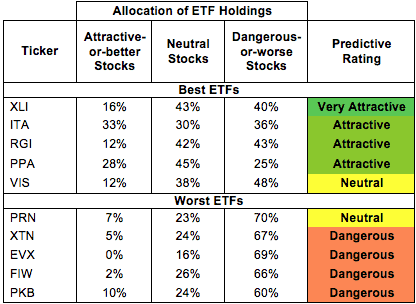
*Best ETFs exclude ETFs with TNAs less than $100 million for inadequate liquidity.
Sources: New Constructs, LLC and company filings
Figure 2: Mutual Funds with the Best & Worst Ratings – Top 5
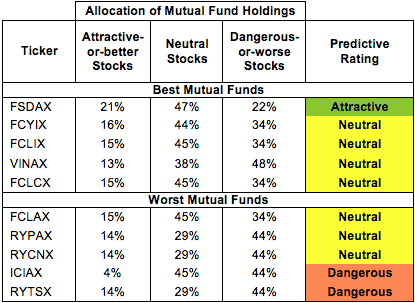
* Best mutual funds exclude funds with TNAs less than $100 million for inadequate liquidity.
Sources: New Constructs, LLC and company filings
State Street SPDR Industrial Select Sector Fund ETF (XLI) is my top-rated Industrials ETF and Fidelity Select Portfolios: Defense and Aerospace Portfolio (FSDAX) is my top-rated Industrials mutual fund. XLI earns my Very Attractive rating and FSDAX earns my Attractive rating.
PowerShares Dynamic Build & Construction ETF (PKB) is my worst-rated Industrials ETF and Rydex Series Funds: Transportation Fund (RYTSX) is my worst-rated Industrials mutual fund. Both earn my Dangerous rating.
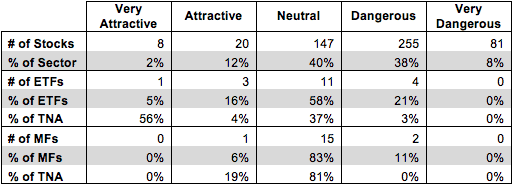
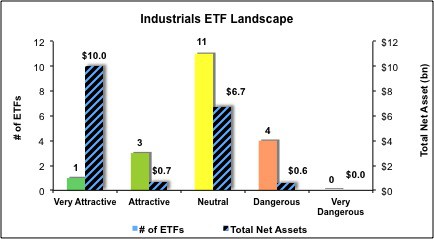
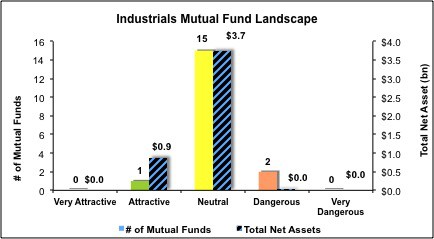
Figure 3 shows that 28 out of the 511 stocks (over 14% of the market value) in Industrials ETFs and mutual funds get an Attractive-or-better rating. However, only 4 out of 19 Industrials ETFs (over 59% of total net assets) and 1 out of 18 Industrials mutual funds (less than 19% of total net assets) get an Attractive-or-better rating.
The takeaways are: mutual fund managers allocate too much capital to low-quality stocks and Industrials ETFs hold poor quality stocks.
Figure 3: Industrials Sector Landscape For ETFs, Mutual Funds & Stocks
Sources: New Constructs, LLC and company filings
As detailed in “Cheap Funds Dupe Investors”, the fund industry offers many cheap funds but very few funds with high-quality stocks, or with what I call good portfolio management.
Investors need to tread carefully when considering Industrials ETFs and mutual funds. Only 4 ETFs and 1 mutual fund in the Industrials sector allocate enough value to Attractive-or-better-rated stocks to earn an Attractive rating.
Deere & Co. (DE) is one of my favorite stocks held by XLI and earns my Very Attractive rating. Since 2008, DE has grown after-tax profit (NOPAT) by 12% compounded annually. The company currently earns an impressive 19% return on invested capital (ROIC), well above the 12% ROIC of AGCO Corporation (AGCO), its most significant competitor. As I wrote in May, short-term macroeconomic concerns about agriculture spending have depressed DE’s valuation while the long-term fundamental picture still looks good. Even if we project just modest 4% NOPAT growth compounded annually over the next 10 years, DE is worth ~$130/share today, significantly more than its current valuation of ~$87/share.
SkyWest Inc. (SKYW) is one of my least favorite stocks held by Industrials ETFs and mutual funds and earns my Very Dangerous rating. Over the past decade, SKYW has grown NOPAT by only 3% compounded annually. SKYW’s ROIC of 4% puts it in the bottom quintile of the over 3,000 companies we cover. Despite this slow growth and low profitability, SKYW is still priced as a consistently growing company. To justify its current price of ~$12/share, SKYW must grow NOPAT by 8% compounded annually for the next 20 years. 8% growth is quite optimistic for a company with SKYW’s track record, and two decades of profit growth is an ambitious projection in the cyclical airline industry.
421 stocks of the 3000+ I cover are classified as Industrials stocks.
Figures 4 and 5 show the rating landscape of all Industrials ETFs and mutual funds.
My Sector Rankings for ETFs and Mutual Fundsreport ranks all sectors and highlights those that offer the best investments.
Figure 4: Separating the Best ETFs From the Worst ETFs
Sources: New Constructs, LLC and company filings
Figure 5: Separating the Best Mutual Funds From the Worst Mutual Funds
Sources: New Constructs, LLC and company filings
Review my full list of ratings and rankings along with reports on all 19 ETFs and 18 mutual funds in the Industrials sector.
Disclosure: NewConstructs staff receive no compensation to write about any specific stock, sector, or theme.


