
Best And Worst ADRs
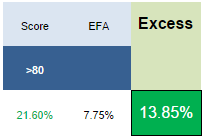
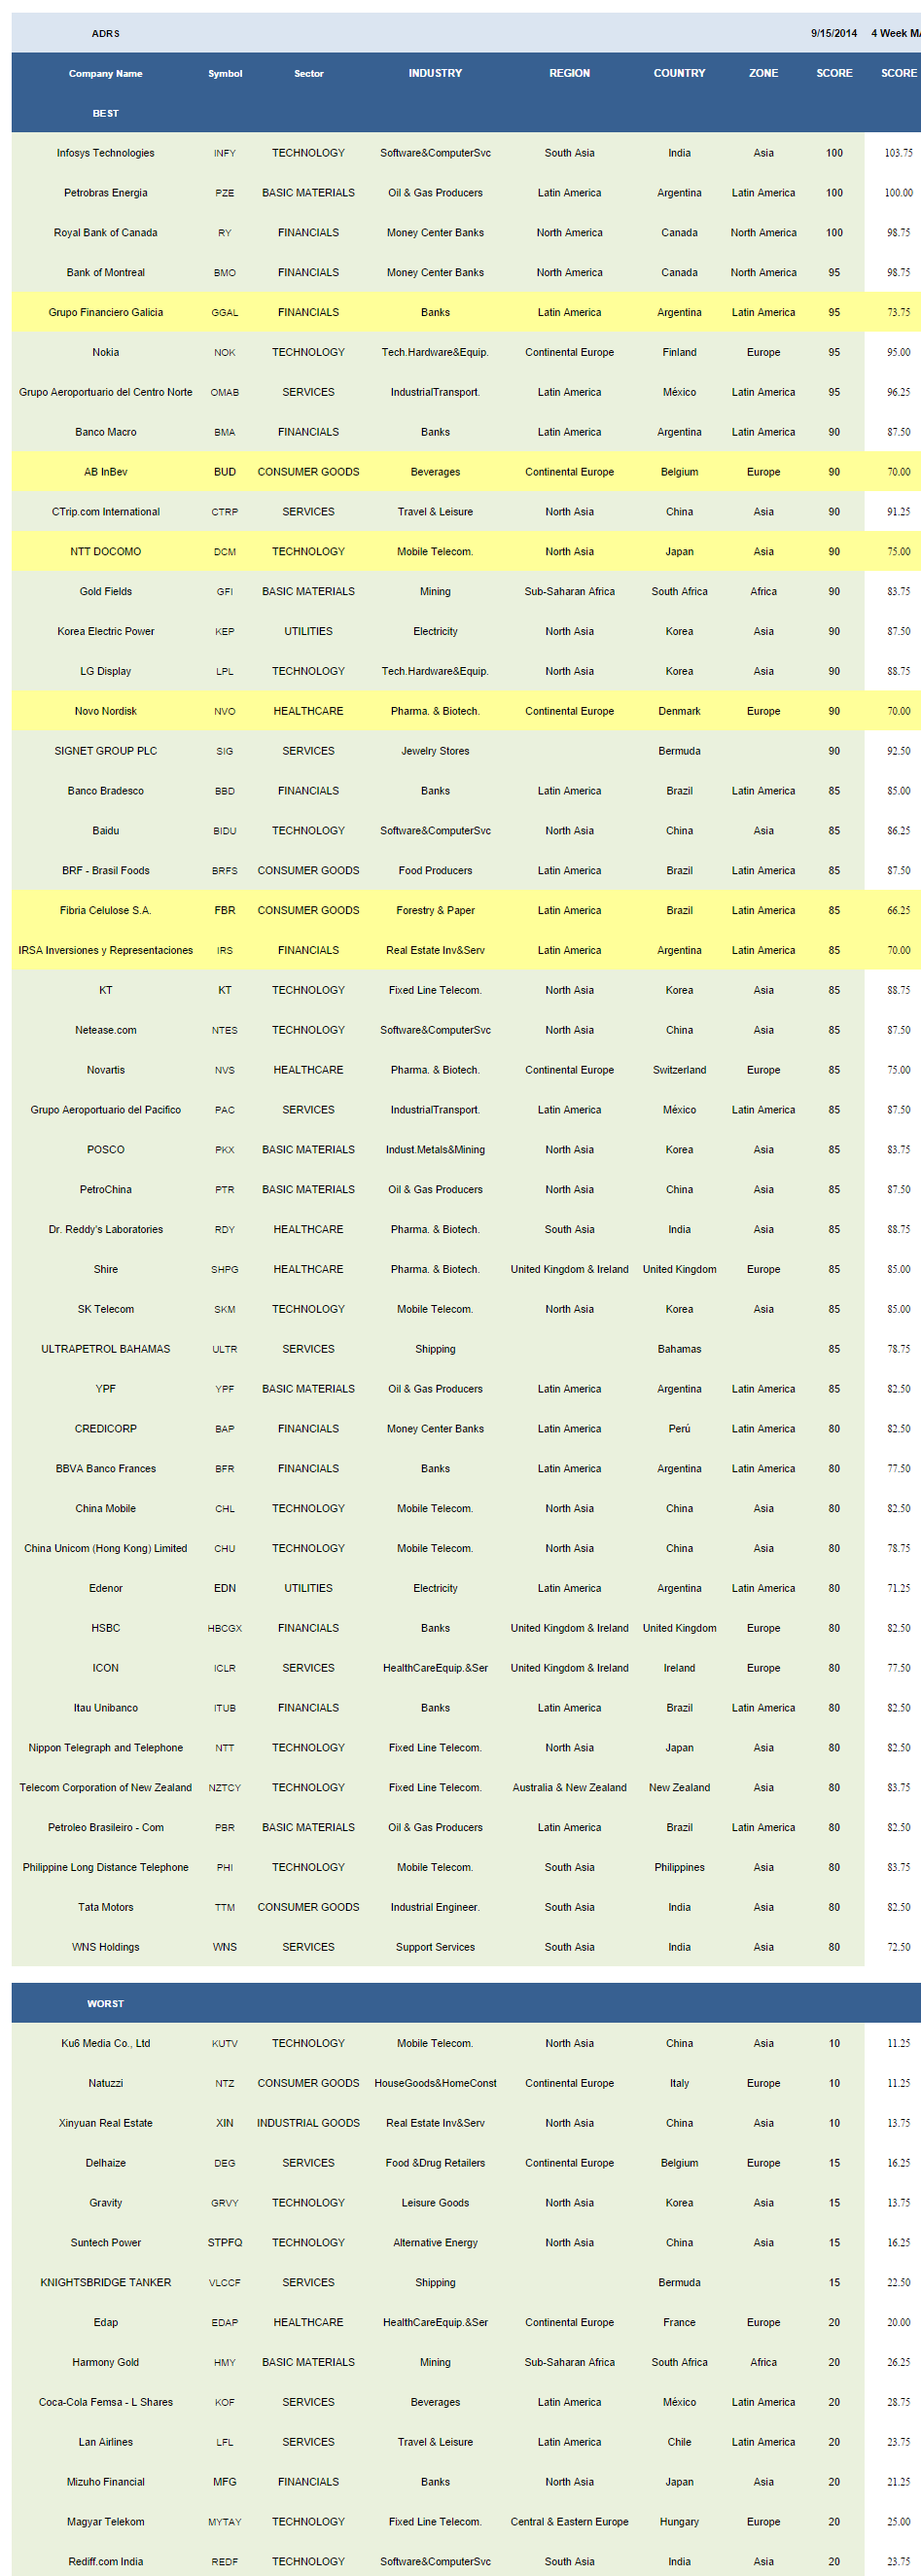
The best scoring ADRs from one year ago (9/16/2013) returned an average 21.6%, 13.85% better than the MSCI EAFE index (EFA). The best performing from our list have been YPF up 98%, BMA up 96%, and GGAL up 75%.
ADRs Best & Worst Report
The average ADR score is 53.28 this week, below the four week moving average score of 55.69. The average ADR is trading -18.24% below its 52 week high, -0.59% below its 200 dma, has 4.26 days to cover held short, and is expected to post EPS growth of 18.47% next year.
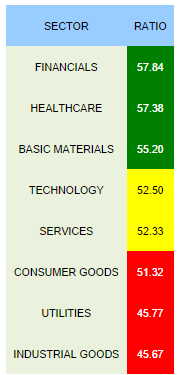
The top scoring sector across our ADR universe is financials (RY, GGAL, BMO, BMA, IRS, BBD, ITUB, HBC, BFR, BAP). Healthcare (NVO, SHPG, RDY, NVS, SNY) and basic materials (PZE, GFI, YPF, PTR, PKX, PBR, CEO, ACH) also score above average. Technology and services score in line. Consumer goods, utilities, and industrial goods score below average.
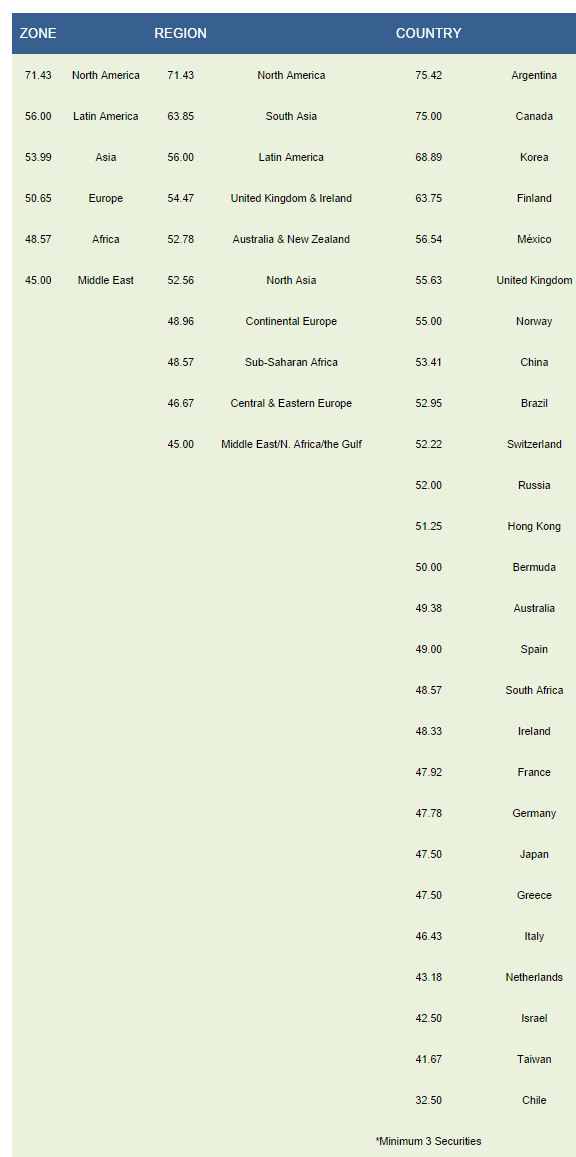
North America (RY, BMO, ECA, BCE) and Latin America (PZE, OMAB, GGAL, BMA, PAC, IRS, BBD, FBR, BRFS, YPF, EDN, ITUB, BFR, BAP, PBR) are the best scoring zones. North America, South Asia (INFY, RDY, PHI, WNS, TTM, IBN, TLK, HDB), and Latin America are the top scoring regions. Argentina (PZE, GGAL, BMA, IRS, YPF, EDN, BFR), Canada (RY, BMO, ECA), Korea (KEP, LPL, SKM, KT, PKX), Finland (NOK, MXCYY), and Mexico (OMAB, PAC, IBA, GMK) are the highest scoring countries.
Disclosure: None.


