
Central Bank “Wealth Effects” Doctrine At Work
The purpose of central bank financial repression and ZIRP is to distort and inflate asset prices. Our monetary politburo even admits that it is in the monetary scam business via its self-serving doctrine called “wealth effects”.
The game here is to drive the stock market averages ever higher through massive liquidity injections into the Wall Street dealer markets. This purportedly causes people to feel richer and to spend and invest more, creating a virtuous circle of prosperity, world without end.
We know by now, however, that “wealth effects” money printing does not help the main street economy. And while it does produce awesome financial market gains—–these turn out to be unsustainable bubbles that inexorably crash. Since the turn of the century, most central banks have participated in this scam—either because they have embraced the Keynesian gospel or have joined the money printing party out of defensive necessity to protect against inflation of their own exchange rates. So the resulting financial bubbles have been global in scope.
During the last global boom cycle, central banks led by the Fed and the US housing bubble drove the aggregate capitalization of world stock markets from $30 trillion to $60 trillion in less than 48 months. Needless to say, the world’s sustainable wealth did not grow by even a fraction of that amount during this brief interval between 2004 and 2008.
Indeed, in much of Europe and the US real wealth was being destroyed by vast malinvestments in housing, real estate and public infrastructure; and in EM economies like China’s, similar wealth destruction was manifested in monumental, uneconomic investments in resource extraction and industrial production and transportation. Nevertheless, this central bank fueled financial bubble reached a tipping point in 2008, and then plunged violently.
As shown below, within a 15 month period, nearly $35 trillion of global equity market cap evaporated, taking global market cap to below its pre-2004 level.
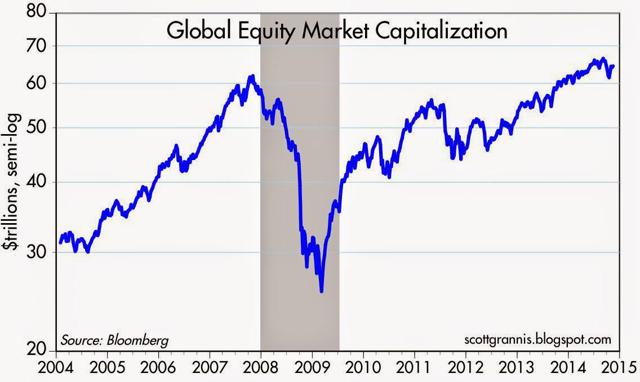
It didn’t take central banks long to double down, of course. During the period since the Lehman failure in September 2008, the aggregate balance sheet of global central banks has exploded from approximately $6 trillion to $16 trillion, thereby inciting the recrudescence of an even more fantastic global financial bubble.
As shown above, global equity market cap has soared by $40 trillion since the March 2009 bottom to new all-times highs. But do not be troubled. The Wall Street stock peddlers who moonlight as “economists” and “strategists” assure us that the 2008-2009 plunge was all a vast mistake——a temporary panic in the financial markets caused by a lapse of faith in the capacity of the state through its central banking and fiscal branches to keep the GDP “print” expanding, profits growing and the stock averages rising.
Let's see. If we just forget the 2008-2009 “mistake” and wind back to the 2004 starting point in the above graph, we see that the global equity market cap has grown by about 120% over the 10 year period. That computes to a compound annual growth rate of 8%.
Yet why in the world would the paper wealth of the world’s stock markets grow at such a robust rate when the entire global economy has been foundering since 2004 in most of the DM world; or simply printing higher but unsustainable GDP stats through the foolish expedient of massive, state subsidized spending on infrastructure and real estate development in much of the EM world. Think the ghost cities, empty malls and unutilized airports, bridges and highways in China.
Starting here at home, therefore, the last decade does not provide much support for the $35 trillion equity gain since 2004. In fact, US real GDP in the US has expanded by a paltry 1.5% annually during that period—–which is by far the lowest rate for any ten year period in modern US history.
![]()
And in the rest of the DM world, there results have been even more meager. Real GDP in the EC, for example, has grown at a 0.5% annual rate during the last decade. In Japan, the results have been equally dismal—with GDP growth clocking at a hardly recordable 0.4% per annum.
![]()
![]()
So when upwards of 60% of the global economy is in “creeper gear” and shows no signs of breaking out of this trend, why would the market cap of publicly traded companies, which rely on these DM economies for an overwhelming share of their profits, soar by $35 trillion or 8% per annum?
The answer, of course, is that PE multiples have risen sharply—from about 10X to 20X reported earnings—and the profit share of these faltering GDP levels have also soared to historic peaks. Stated differently, much of this $35 trillion paper gain over the last decade is a product of central bank driven financialization, not sustainable growth in world output and real wealth.
The former has produced a dangerously expanding gap between rising PE multiples and stagnating real growth; and has also incentivized global corporations to shed investments in labor, fixed assets and R&D in order to fund financial engineering schemes such as stock buybacks and M&A which goose accounting profits in the short-run, but liquidate the ingredients of long-term growth and innovation. Currently, IPM, Hewlett-Packard, Cisco Systems and Proctor & Gamble are among the obvious poster boys.
To be sure, the Wall Street pitch men counter with the “BRICS” story—the notion that the growth baton has been handed off to the EM world and that soaring growth and corporate profits in China, Korea, Brazil and even Africa will take up the slack. In a word, that’s just unadulterated nonsense.
The reported GDPs of the EM economies are vastly bloated by a one-time parlor trick. Namely, the fantastic money printing campaigns of their own central banks, which have resulted in drastic mispricing of capital and out-of-this-world growth in fixed assets. Needless to say, however, the law of supply and demand has not yet been repealed–even in Beijing and Brasilia—-and therefore it is only a matter of time before the EM economies experience their own day of reckoning.
Thus, during the decade through 2014, the People’s Printing Press of China expanded its balance sheet by 7X. Not only has that never been done before, but why in the world would the Wall Street pitch men believe that a command economy which is entirely controlled from the center and which has expanded its debt from $1 trillion to $25 trillion during the brief course of this century, is even remotely capable of the moderately stable performance history of the DM economies which comprise their data bases and charts.

The fact is, China is a colossal house of cards, and so are the satellite economies which have fed raw materials into the maws of its overheated industrial furnaces.
Take Brazil, for example. It has been run by crony capitalists and labor-socialists for the past decade, who, like their Chinese counterparts, have had no difficulty cranking up the printing presses at their central bank. But with the China boom now rapidly cooling and iron ore prices, for example, rapidly collapsing, the accumulated waste, inefficiency and corruption of the past ten years of global central bank money printing has begun to catch-up. In fact, Brazil is tumbling into recession and political crisis, and is likely to remain there for years to come. There has been no EM miracle there; just a red hot printing press and a statist simulacrum of prosperity.

So that takes us to the true nature of Keynesian central banking. The actual impact of the current “wealth effects” regime is not economic growth and rising profits, but, instead, a vast inflation of financial assets. Yet with the passage of time and serial attempts to reflate each busted bubble, the degree to watch valuations have become distorted is completely lost in the recency bias of Wall Street and its financial media echo boxes.
Perhaps, then, it takes a picture to correct the endless bogus words of the mainstream narrative. The thing about central bank driven bubble finance is that it infects all asset valuations because it enables carry trade speculators to ply their trades with zero cost money and radically depresses the “cap rates” which underlie valuations of all financial assets and real estate.
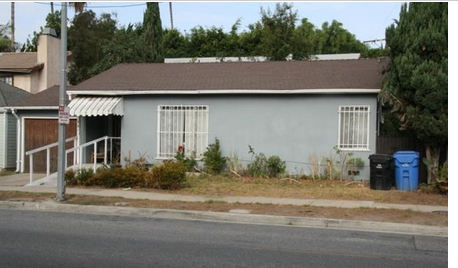
To make a long story short, here is your $500k “crap shack” in one of southern California’s most distorted and over-heated housing markets. As Dr. Housing Bubble well explains, we have now reached the point where central bank financial repression has brought casino finance to every nook and cranny of the main street economy.
Stated differently, the world’s central banks have not created $35 trillion of new wealth since 2004. But they have fueled the rise of “crap shack” valuations nearly everywhere on the planet.
From Dr. Housing Bubble
Take a look at this Culver City home:
9435 Lucerne Ave, Culver City, CA 90232
2 beds, 1 bath, 874 square feet
I love the effort that went into the photo. Bars on the windows and garbage cans in the yard. You also have deferred gardening here. But of course, it is in Culver City so let the buying begin. Let us look at the ad and the pitch being used:
“Ideal Culver City Location! This wonderful home is located simply a stone away to the heart of downtown Culver City. Don’t miss this great opportunity.”
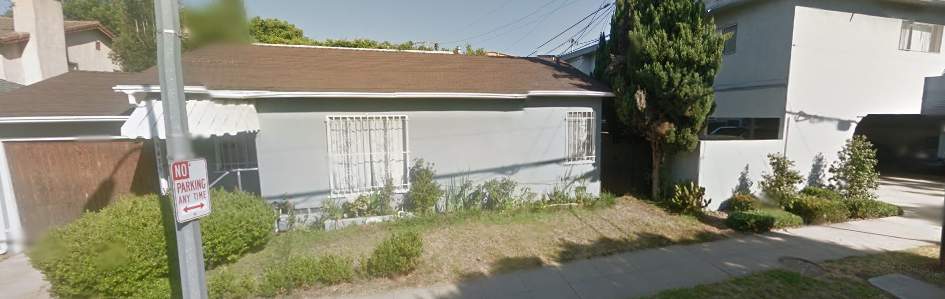
A stone away from downtown? Maybe a couple of Waste Management trash bins away from downtown. Here is a different viewpoint on the place:
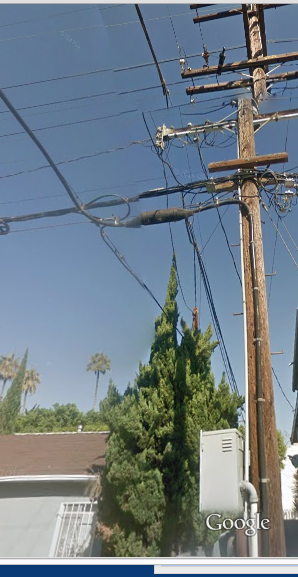
Street parking might be a pain and you also have massive electrical wiring near the property:
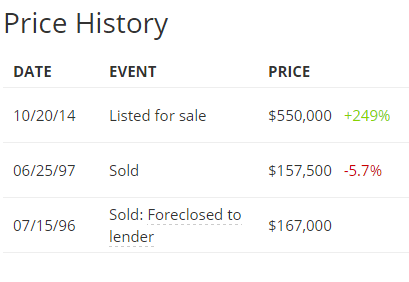
Then again, who cares since we are talking about Culver City. This place is listed at $550,000. Take a look at the price history:
20 percent down is $110,000 of cold hard cash. Your total PITI will be around $2,500 per month after plunking down $110,000. Good deal? If you believe it is, then why not go out and buy this place? Simple enough. You can easily look up this place and give a real estate agent a ring. The mentality right now is that some “other” buyer is going to step in and purchase this place so the gig continues. Yet when I talk with serious investors they are absolutely not looking to buy in these markets. Flippers seem to be more cautious with their purchases as the year comes to an end.
This place was built in 1946 and looks like it will need work. It last sold in 1997 for $157,500. The current sellers are in fantastic shape and have a lot of wiggle room in terms of price and coming out ahead. I have a hard time seeing someone paying $550,000 on this 874 square foot place and making it their granite countertop and stainless steel appliance filled sarcophagus. What I do see is someone pitching this place as a pit stop before moving into a much larger $700,000 crap shack. You have to love California real estate!
more

Comments
 No Thumbs up yet!

