
Claims Data Affirms Government "Shout" Down Had No Lasting Impact; Stocks Still Dangerously Extended
First time unemployment claims essentially met expectations this week as ‘conomists had one of their rare correct guesses. But I should not be so hard on the ‘conomist crowd. The seasonal adjustment factor applied to the comparable week of the year over the prior 10 years has varied by +/-30,000 claims from year to year. So when the market gets upset or excited about a ‘conomists’ consensus miss of 10,000 or 20,000 or even 30,000, it’s really much ado about nothing. It’s statistical noise.
The Labor Department reported that in the week ending October 26, the advance figure for seasonally adjusted initial claims was 340,000, a decrease of 10,000 from the previous week’s unrevised figure of 350,000.
The consensus estimate of economists of 335,000 for the SA headline number was close to the mark (see footnote 1). Over the prior month economists were consistently unable to guess the impact of the government shout down, severely underestimating claims in those weeks. They apparently are not aware of the real-time hard data on Federal Withholding taxes, which I track weekly in the Treasury Update. That showed withholding tax collections dropping sharply over the period of the shout down.
The whole weekly ritual of reacting to these fictional, seasonally adjusted headline numbers is ridiculous. But the weekly data does have real value. Tracking only the actual, not seasonally finagled number exactly as the Feds collect the actual filings from the 50 states gives us a good picture of the trend of the economy nearly in real time, unlike most economic data which usually has a lag of at least a month. With no more government and related workers being furloughed since October 16, last week’s and this week’s actual, unadjusted numbers give us a good idea of the underlying trend.
The headline seasonally adjusted data is the only data the media reports but the Department of Labor (DOL) also reports the actual data, not seasonally adjusted (NSA). The DOL said in the current press release, “The advance number of actual initial claims under state programs, unadjusted, totaled 317,580 in the week ending October 26, an increase of 6,064 from the previous week. There were 339,917 initial claims in the comparable week in 2012.” [Added emphasis mine] See footnote 2.
Claims were up year to year in the first week of the government shout down, then nearly even on a year to year basis in the second week. By the October 19 week claims began to return to their past trend of trending lower at about 8% per year. In the latest week actual filings were down 6.6% versus the corresponding week last year, slightly worse than the trend average of -7.9% per year over the past 104 weeks.
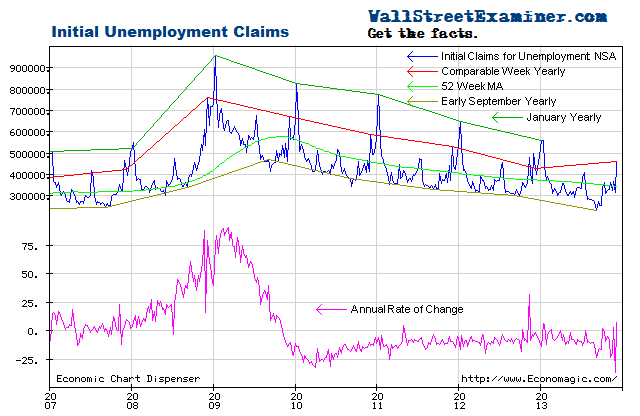
Initial Unemployment Claims – Click to enlarge
There’s significant volatility in this number, with a usual range of zero to -20%. In the second and third quarters, claims as a percentage of the total employed were at levels last seen at the end of the housing bubble, just before the market and economy collapsed. Since then they’re returned to a somewhat higher level, settling in at about 0.23% of total employed.

Initial Unemployment Claims Percentage of Total Employed – Click to enlarge
The fact that the numbers rebounded immediately after the ending of the government shout down suggests that there will be no lasting damage, contrary to the braying of the political and economic chattering classes, all of whom are pushing their own agendas.
The current weekly change in the NSA initial claims number is an increase of 6,000 (rounded and adjusted for the usual undercount) from the previous week. That compares with a decrease of 5,000 for the comparable week last year. The fourth week of October was an up week in 6 of the prior 10 years. The average change for the comparable week over the prior 10 years was an increase of 13,000. This week’s number, while worse than last year was in line with the prior 10 year average.
Federal withholding tax data slumped sharply in the first half of October. It then began a gradual recovery after mid month but is not back to trend yet. Since withholding is collected after the end of the pay period, the effects of Federal workers returning to work should be seen fully in that data within the next few days. I’ll report on that in the weekly Professional Edition Treasury update.
To signal a weakening economy, current weekly claims would need to be greater than the comparable week last year. With the exception of the October 5 week, which got a mulligan because of the government shout down, that has not happened. The trend had previously been one of accelerating improvement in spite of the fact that the comparisons are now much tougher than in the early years of the 2009-13 rebound. The data has returned to trend over the past two weeks, but again, with much tougher comparisons versus the prior year now, I would expect some slowing in the rate of improvement to be normal, and not an indication of a weakening economy.
Relative to the trends indicated by unemployment claims, stocks have been extended and vulnerable since May. QE has pushed stock prices higher but has done nothing to stimulate jobs growth.
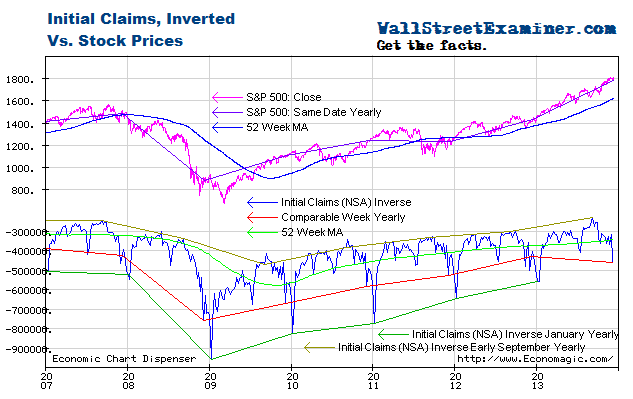
Initial Unemployment Claims and Stock Prices- Click to enlarge
I plot the claims trend on an inverse scale on this chart with stock prices on a normal scale. The acceleration of stock prices in the first half of 2013 suggested that bubble dynamics were at work in the equities market, thanks to the Fed’s money printing. Those dynamics appeared to have ended in July but the zombie has kept coming back to life.
Get regular updates the machinations of the Fed, Treasury, Primary Dealers and foreign central banks in the US market, in the Fed Report in the Professional Edition, Money Liquidity, and Real Estate Package. Click this link to try WSE's Professional Edition risk free for 30 days!
Copyright © 2012 The Wall Street Examiner. All Rights Reserved.


