
Economic Forecast January 2014: Slight Growth Deceleration
 Our January 2013 Economic Forecast continues to show a growing economy – but growing at a slower rate than last month. Most portions of our economic model are expanding.
- Since the last forecast, there have been two monthly releases of disposable personal income and expenditures. The gap between income and expenditure growth, which had closed, has now reopened at an accelerating growth rate. Econintersect considers this a headwind to economic growth in January 2013. Note that our quantitative analysis which builds our model does not include personal income or expenditures.
- Econintersect checks its forecast using several alternate monetary based methods – and the check forecasts confirm our non-monetary based forecast.
- Note that all the graphics in this post auto-update. The words are fixed on the day of publishing, and therefore you might note a conflict between the words and the graphs due to backward data revisions and/or new data which occurs during the month.
This post will summarize the:
- leading indicators,
- predictive portions of coincident indicators,
- review of the technical recession indicators, and
- interpretation of our own index – Econintersect Economic Index (EEI) – which is built of mostly non-monetary “things” that have been shown to be indicative of direction of the Main Street economy at least 30 days in the future.
Consider:
- The consumer is still consuming. This year (2013) is only the fourth period in history where the ratio of spending to income has exceeded 0.92 (April 1987, the months surrounding the 2001 recession, from September 2004 to the beginning of the 2007 Great Recession, and now). Currently this ratio continues above 0.92 – and remains high historically. This high ratio of spending/income will act as a constraint to any major gain in consumer spending absent any increases in income.
Seasonally Adjusted Spending’s Ratio to Income (a declining ratio means Consumer is spending less of Income)

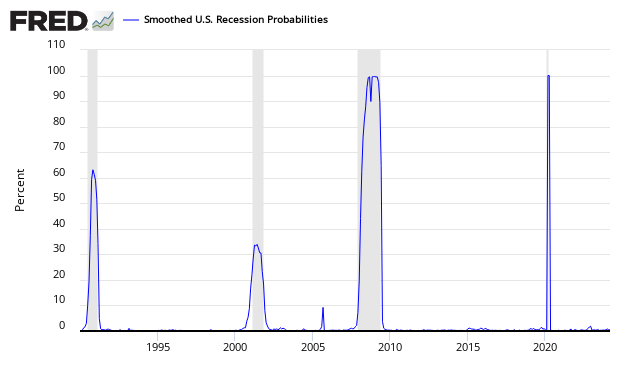
- The St. Louis Fed produces a Smoothed U.S. Recession Probabilities Chart which is currently giving no indication of a recession.
Smoothed recession probabilities for the United States are obtained from a dynamic-factor markov-switching model applied to four monthly coincident variables: non-farm payroll employment, the index of industrial production, real personal income excluding transfer payments, and real manufacturing and trade sales. This model was originally developed in Chauvet, M., “An Economic Characterization of Business Cycle Dynamics with Factor Structure and Regime Switching,” International Economic Review, 1998, 39, 969-996. (http://faculty.ucr.edu/~chauvet/ier.pdf)
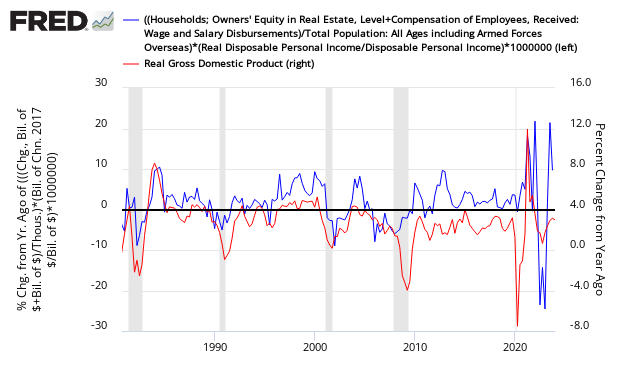
- Joe Sixpack’s economic position is strengthening – albeit at a slowing rate of growth. The Econintersect index’s underlying principle is to estimate how well off Joe feels. The index was documented at a bottom in the July 2012 forecast. Joe and his richer friends are the economic drivers. Joe is the blue line in the graph below, and that is not close to the levels associated with past recessions. Note this index is updated every quarter.
Joe Sixpack Index (blue line, left axis)
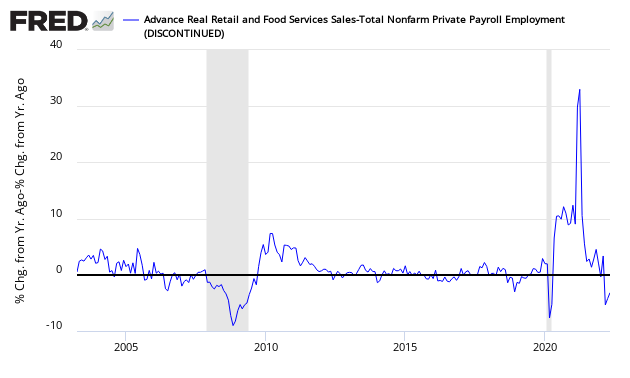
- Econintersect reviews the relationship between the year-over-year growth rate of non-farm private employment and the year-over-year real growth rate of retail sales. The short term trend is now mixed depending on the periods selected. As long as retail sales grow faster than the rate of employment gains (above zero on the below graph) – a recession is not imminent.
Growth Relationship Between Retail Sales and Non-Farm Private Employment – Above zero represents economic expansion
- Most economic releases are based on seasonally adjusted data which is revised for months after issuance so a contraction in a particular release may not be obvious for many months.
The Leading Indicators
The leading indicators are monetary based to a large extent. Econintersect‘s primary worry in using monetary based methodologies to forecast the economy is the current extraordinary monetary policy which may (or may not) be affecting historical relationships.
Econintersect does not use data from any of the leading indicators in its economic index. All leading indices in this post look ahead six months – and are all subject to backward revision.
ECRI’s Weekly Leading Index (WLI) – Econintersect is now ignoring ECRI’s recession call as it is obvious it is no longer relevant. ECRI’s WLI index value remains marginally above zero (but continues to degrade in the last few weeks) which according to their definition means the economy six month from today will be better than today. A positive number shows an expansion of the business economy, while a negative number is contraction. The trends in 2013 have remained in a very narrow slightly positive channel.
Current ECRI WLI Index

The Conference Board’s Leading Economic Indicator (LEI) – Looking at historical relationships, this index’s 3 month rate of change must be in negative territory many months (6 or more) before a recession occurred. In mid-2012, the rate-of-change made several small incursions into negative territory – but is currently in positive territory implying any recession is months away.

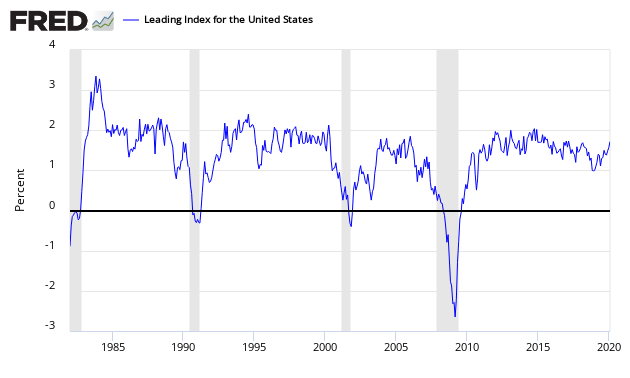
Leading Index for the United States from the Philadelphia Fed – This index is the super index for all the state indices.
The leading index for each state predicts the six-month growth rate of the state’s coincident index. In addition to the coincident index, the models include other variables that lead the economy: state-level housing permits (1 to 4 units), state initial unemployment insurance claims, delivery times from the Institute for Supply Management (ISM) manufacturing survey, and the interest rate spread between the 10-year Treasury bond and the 3-month Treasury bill.
Nonfinancial leverage subindex of the National Financial Conditions Index – a weekly index produced by the Chicago Fed signals both the onset and duration of financial crises and their accompanying recessions. Econintersect now believes this index may be worthless in real time as the amount of backward revision is excessive – but present this index for information only. This index was designed to forecast the economy six months in advance. The chart below shows the current index values, and a recession can occur months to years following the dotted line below crossing above the zero line. If the current trend lines hold, the next recession could be less than two years away.

Leading Indicators Bottom Line – no recession in the next six months:
- ECRI’s WLI remains positive.
- The Conference Board (LEI) is indicating modest growth over the next 6 months.
- The Philly Fed’s Leading Index is indicating economic growth.
- The Chicago Fed’s Nonfinancial leverage subindex is not close to warning a recession could be near.
Forward Looking Coincident Indicators
Here is a run through of the most economically predictive coincident indices which Econintersect believes can give up to a six month warning of an impending recession – and do not have a history of producing false warnings. Econintersect does not use any of these indicators in its economic forecast.
Consider that every recession has different characteristics – and a particular index may not contract during a recession, or start contracting after the recession is already underway.
Truck transport portion of employment – to search for impending recessions. Look at the year-over-year zero growth line. For the last two recessions it has offered a six month warning of an impending recession with no false warnings. Transport is an economic warning indicator because it moves goods well before final retail sales occur. Until people stop eating or buying goods, transport will remain one of the primary economic pulse points.
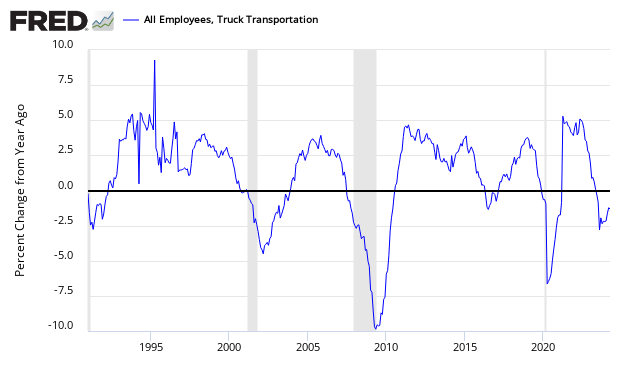
Transport employment growth remains far above the zero growth line – but is in an obvious declining growth trend line. As transport provides a six month recession warning – the implication is that any possible recession is further than six months away.
Business Activity sub-index of ISM Non-Manufacturing – this index is noisy. The index is well above 55 (below 55 is a warning that a recession might occur, whilst below 50 is almost proof a recession is underway).

Predictive Coincident Index Bottom Line – No predictive index is warning of a recession.
- True economic activity (not monetary based GDP) was expanding in the most recent hard economic data around 2% plus in many sectors of the economy using non-monetary pulse points based on these indices shown above, and other indices which Econintersect are indicative of the real economy.
- Overall the coincident data seems stable.
Technical Requirements of a Recession
Sticking to the current technical recession criteria used by the NBER:
A recession is a significant decline in economic activity spread across the economy, lasting more than a few months, normally visible in real GDP, real income, employment, industrial production, and wholesale-retail sales. A recession begins just after the economy reaches a peak of activity and ends as the economy reaches its trough. Between trough and peak, the economy is in an expansion. Expansion is the normal state of the economy; most recessions are brief and they have been rare in recent decades.
….. The committee places particular emphasis on two monthly measures of activity across the entire economy: (1) personal income less transfer payments, in real terms and (2) employment. In addition, we refer to two indicators with coverage primarily of manufacturing and goods: (3) industrial production and (4) the volume of sales of the manufacturing and wholesale-retail sectors adjusted for price changes.
Below is a graph looking at the month-over-month change (note that multipliers have been used to make changes more obvious).
Month-over-Month Growth Personal Income less transfer payments (blue line), Employment (red line), Industrial Production (green line), Business Sales (orange line)
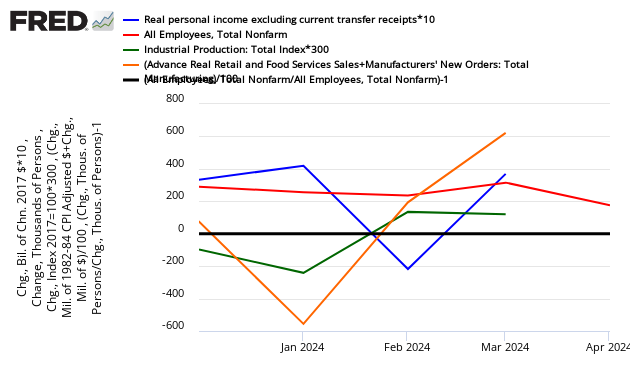
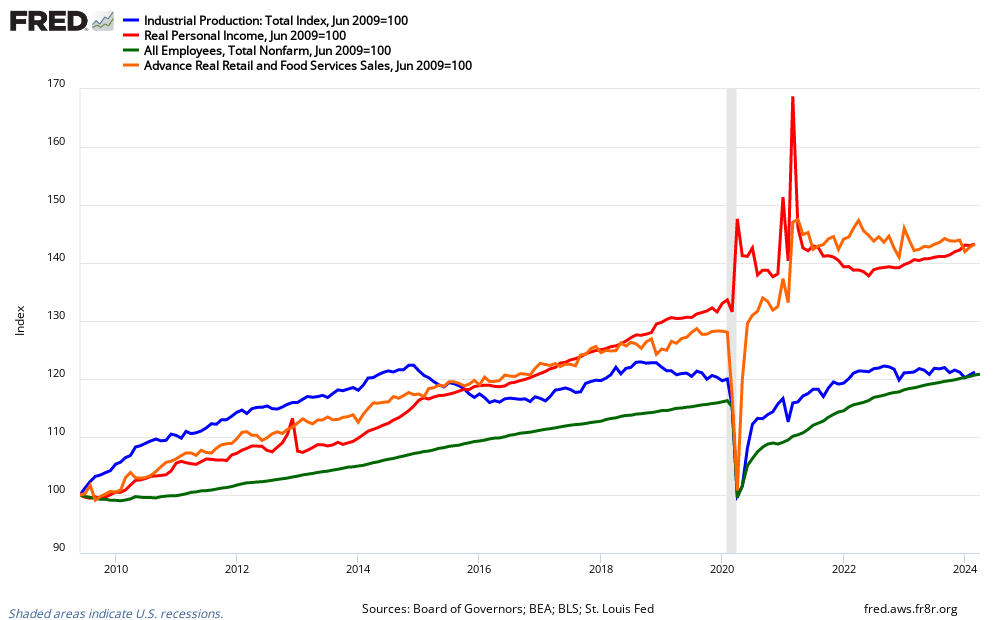
In the above graph, if a line falls below the 0 (black line) – that sector is contracting from the previous month. At his point, only personal income is in the warning zone. Again, this is a rear view mirror, is subject to revision, and is not predictive of where the economy is going. Another way to look at the same data sets is in the graph below which uses indexed real values from the trough of the Great Recession.
Indexed Growth Personal Income less transfer payments (red line), Employment (green line), Industrial Production (blue line), Business Sales (orange line)
NBER Recession Marker Bottom Line – There does not seem to be any concern about recession in the NBER recession markers.
Econintersect believes that the New Normal economy has different dynamics than most economic models are using.
Economic Forecast Data
The Econintersect Economic Index (EEI) is designed to spot Main Street and business economic turning points. This forecast is based on the index’s three month moving average. The three month rolling index value declined this month after improving for four month. As a summary:
- The government portion relating to business and main street is contracting.
- The business portion is moderately positive but weaker than the previous month.
- The consumer portion is marginally positive.
The EEI is a non-monetary based economic index which counts “things” that have shown to be indicative of direction of the Main Street economy at least 30 days in the future. Note that the Econintersect Economic Index is not constructed to mimic GDP (although there are correlations, but the turning points may be different), and tries to model the economic rate of change seen by business and Main Street. The vast majority of this index uses data not subject to backward revision.
Econintersect Economic Index (EEI) with a 3 Month Moving Average (red line)

/images/z forecast1.PNG
The red line on the EEI is the 3 month moving average which is at 0.52 (down from last month’s 0.55), while the monthly index declined from 0.60 to 0.45. The economic forecast is based on the 3 month moving average as the monthly index is very noisy. Readings below 0.4 indicate a weak economy, while readings below 0.0 indicate contraction.
 The EEI is now trending down.
A positive value of the index represents main street economic expansion. This month’s value of 0.52 shows the main street economy’s relative rate of growth is weaker than last month.
Consumer and business behavior (which is the basis of the EEI) either lead or follow old fashion industrial age measures such as GDP depending on the dynamic which is driving the economy. The main street sector of the economy lagged GDP in entering and exiting the 2007 Great Recession.
As Econintersect continues to back check its model, from time-to-time slight adjustments are made to the data sets and methodology to align it with the actual coincident data. To date, when any realignment was done, there have been no changes for trend lines or recession indications. Most changes to date were to remove data sets which had unacceptable backward revisions or were discontinued. Documentation for this index was in the October 2011 forecast.
Jobs Growth Forecast Improves
The Econintersect Jobs Index is forecasting non-farm private jobs growth of 120,000 – down from last month’s 130,000. The fundamentals which lead jobs growth had been weakening beginning with October forecast. The good news at this point, is that employment fundamentals likely will improve in 2014.
Comparing BLS Non-Farm Employment YoY Improvement (blue line, left axis) with Econintersect Employment Index (red line, left axis) and The Conference Board ETI (yellow line, right axis)

/images/employment_indices.png
The Econintersect Jobs Index is based on economic elements which create jobs, and (explanation here) measures the historical dynamics which lead to the creation of jobs. It measures general factors, but it is not precise (quantitatively) as many specific factors influence the exact timing of hiring. This index should be thought of as a measurement of jobs creation pressures.
At the present time, jobs growth year-over-year (green line in below graph) is averaging above the levels forecast by the Econintersect’s Jobs Index (blue line in below graph).
Econintersect Employment Forecast (blue line), Fudged Forecast* (red line), and BLS Non-Farm Jobs Month-over-Month Growth (green line)

/images/z forecast2.PNG
* fudged growth (red line in above graph) based on deviation between forecast & current actual using a 3 month rolling average
A fudge factor (based on deviation between the BLS actual growth and the Econintersect Employment Index over the last 3 months – red line in above graph) would project jobs growth at 158,000. The fudge factor is fluid as the BLS has significant backward revision to their jobs numbers.
Analysis of Economic Indicators:
Econintersect analyzes all major economic indicators. The table below contains hyperlinks to posts. The right column “Predictive” means this particular indicator has a leading component (usually other then the index itself) – in other words has a good correlation to future economic conditions.
General Economic Indicators:
Monthly Data: [click here to go to source file]
Quarterly Data: [click here to go to source file]
Aruoba-Diebold-Scotti Business Conditions Index: [click here for source file]
Past EEI Forecasts
None.


