
Economic Portents – Kansas
Here are some economic indicators for Kansas; they indicate rising GDP but stalling real personal income (through 2014Q2), stagnant employment growth, with manufacturing employment deviating from national trends.
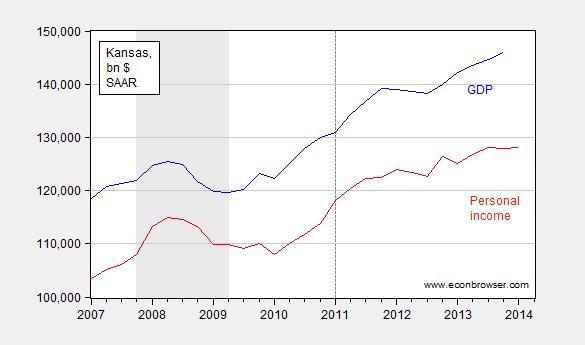
Figure 1: Nominal Gross State Product (blue) and personal income (red). NBER recession dates shaded gray; dashed lines at Brownback administration and beginning of tax cuts. Source: BEA, and BEA via FRED.
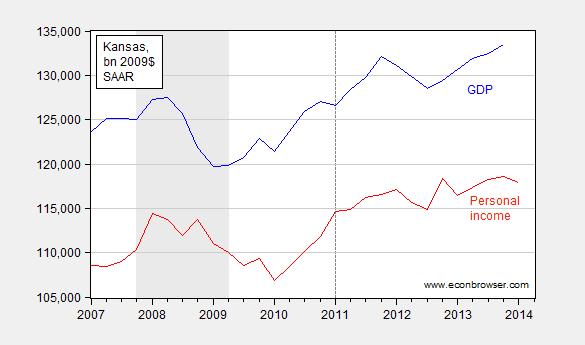
Figure 2: Real Gross State Product (blue) and real personal income (red). Real personal income deflated using Chained CPI. NBER recession dates shaded gray; dashed lines at Brownback administration and beginning of tax cuts. Source: BEA, and BEA and BLS via FRED.
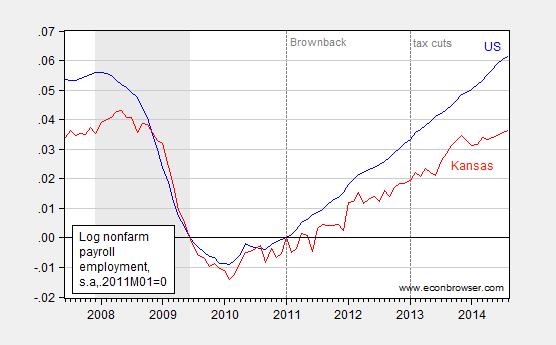
Figure 3: Log nonfarm payroll employment in United States (blue) and in Kansas (red), both seasonally adjusted, normalized to 2011M01=0. NBER recession dates shaded gray; dashed lines at Brownback administration and beginning of tax cuts. Source: BLS and author’s calculations.
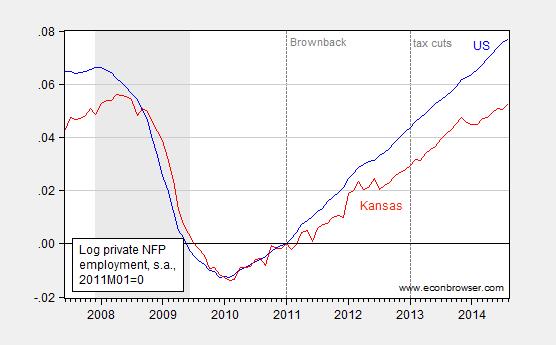
Figure 4: Log private nonfarm payroll employment in United States (blue) and in Kansas (red), both seasonally adjusted, normalized to 2011M01=0. NBER recession dates shaded gray; dashed lines at Brownback administration and beginning of tax cuts. Source: BLS and author’s calculations.
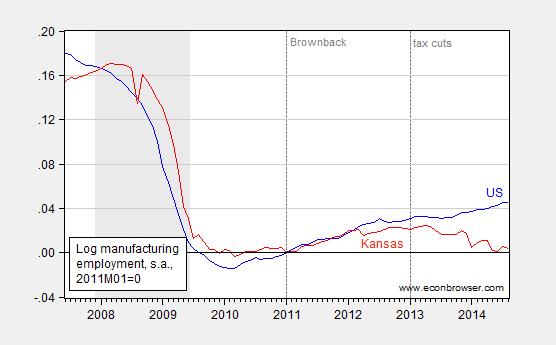
Figure 5: Log manufacturing payroll employment in United States (blue) and in Kansas (red), both seasonally adjusted, normalized to 2011M01=0. NBER recession dates shaded gray; dashed lines at Brownback administration and beginning of tax cuts. Source: BLS and author’s calculations.
Note that the cumulative growth gaps in NFP, private NFP and manufacturing employment since 2011M01 are respectively 2.5%, 2.4% and 4.2% (in log terms). Of the 4.2 percentage point manufacturing employment growth gap between the United States and Kansas, 3.1 percentage points are accounted for by the growth trends since 2013M01, when new tax and spending cuts went into effect.
Note that inspection of civilian employment does not provide a “nicer” picture. The cumulative growth gap since 2011M01 is 5.5%. To place this in perspective, the cumulative growth of US civilian employment relative to Kansas since the last cyclical peak (2007M12) is -1.2%.
One excuse sometimes offered for the state’s poor economic performance is the decline in exports. However, July 2014 year-to-date exports are 1.1% higher than the corresponding period in 2013, according to the Census Bureau. This suggests that much of the deterioration in 2014 economic activity is home grown in source.
For a New Classical interpretation of these trends (along with a critique), see this post.
Disclosure: None.


