
EURUSD Weekly Outlook: Continued Plunging? Here’s What To Watch
FX Traders’ weekly EURUSD fundamental & technical picture, this week’s market drivers that could change it- the bullish, the bearish and likely EURUSD direction.
The following is a partial summary of the conclusions from the fxempire.com weekly analysts’ meeting in which we cover outlooks for the major pairs for the coming week and beyond.
Summary
- Technical Outlook: Accelerating deterioration of support, momentum
- Fundamental Outlook 1: Market drivers and lessons- a daily breakdown
- Fundamental Outlook 2: Ukraine, data gap, rate expectations gap all favoring USD over EUR
- Fundamental Outlook 3. Longer Term Considerations
- Fundamental Outlook 4: Likely market drivers to watch for the coming week and key questions
EURUSD Weekly Technical Outlook: Accelerating Deterioration On All Fronts
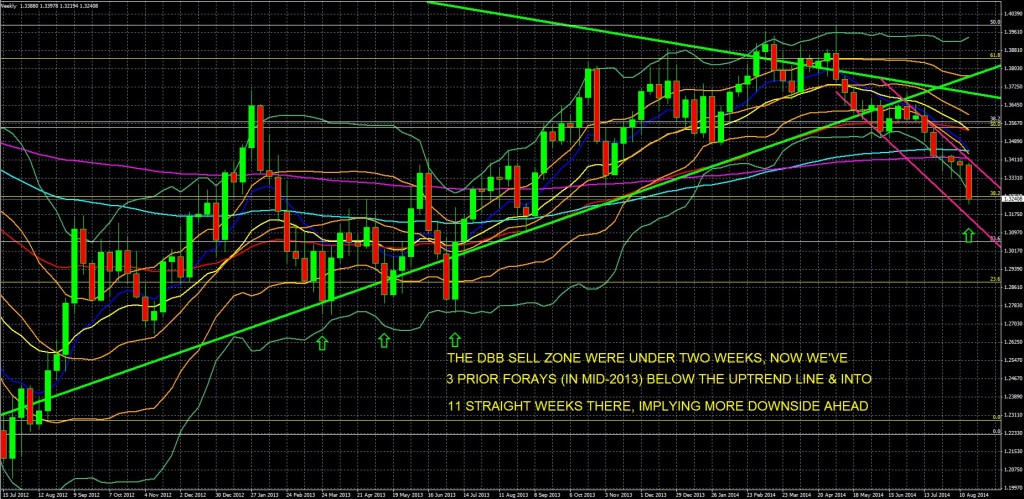
EURUSD Weekly Chart 15 July 2012 to Present
KEY: 10 Week EMA Dark Blue, 20 WEEK EMA Yellow, 50 WEEK EMA Red, 100 WEEK EMA Light Blue, 200 WEEK EMA Violet, DOUBLE BOLLINGER BANDS: Normal 2 Standard Deviations Green, 1 Standard Deviation Orange. Green downtrend line from EURUSD peak of July 2008 to present, green uptrend line from August 2012 to present. White Fibonacci retracement lines for downtrend of August 2008 To June 2010, yellow Fibonacci retracement lines for downtrend of May 2011 To July 2011.
Source: MetaQuotes Software Corp, www.fxempire.com, www.thesensibleguidetoforex.com
Key Take-Aways Weekly Chart: Bounce or Key Support Breaking? Next Levels To Watch
Continuing the theme of the past 6 weeks, the medium term outlook continues to deteriorate from a variety of technical perspectives, chart patterns, support breakdowns, and strengthening downwards momentum. In addition, the pair’s slow grind lower within its descending channel from of the past 3 weeks accelerated decisively, as Ukraine tensions, data, and central bank expectations all turned further in favor of the USD. See our fundamental analysis for details, of which there are many.
The most outstanding change for the worst is the third consecutive penetration of yet another key support level in as many weeks.
Three weeks ago the pair decisively broke through its 200 week EMA around 1.342 As the oldest of our EMAs, such a confirmed breach takes real conviction among traders that the EURUSD is headed lower..
Last week confirmed that downward breakout with a modestly lower weekly close, yet support at the 1.333 level held for the third straight week despite plenty of bearish news from both the Ukraine crisis and the economic data, offering EURUSD bulls hope for an oversold bounce.
However the past week illustrated how poor most momentum and positioning indicators are for timing bounces, and how it pays to stay short as long as the pair remains within its double Bollinger® band sell zone. The pair not only took out that 1.333 level, it closed Friday below the next major support level at the 38.2% Fibonacci retracement level of the uptrend of August 2012 – May 2014 at 1.3245, to close around 1.3242.
Here are the details of the key elements of the technical breakdown on the weekly EURUSD chart.
- -Bearish Head And Shoulder Pattern Gets Further Confirmation: The past weeks additional declines, after the prior week’s pause (due to a below-forecast US jobs report), confirm the bearish medium term pattern. It’s hardly a classic H&S pattern given the head is dispersed over a few weeks and the somewhat asymmetrical and lopsided shoulders in December 2013 and June 2014 (the June shoulder’s a bit lower).
However the principal behind the H&S pattern applies here. That is, a failed attempt to rally, followed by further declines that suggest the EURUSD’s rally that began in mid-2012 is officially over.
Note the specific elements of the Head and Shoulders Topping Pattern:
-
- –We’ve a temporarily successful bounce off late January lows and drive a to new highs from December 2013 to March 2014
- –A pullback that bottoms in mid-June
- –A failed rally that tops out in early July, which, significantly, topped at resistance created by the medium term uptrend line dating back to June 2012, which proved its strength by resisting 4 straight weeks of tests. The current move lower has created a new series of lower lows and lower highs, aka a downtrend. The technical evidence of the new downtrend also includes violation of key support as detailed below.
- -Violation Of Key Support: As noted above
- -Accelerating Downward Momentum
- —All EMAs trending lower except for the longest term, least sensitive 100 and 200 week EMAs, which have flattened. The 20 week EMA (yellow) appear set to cross below the 50 week EMA (red), after the 10 week EMA (blue) crossed below it weeks ago. This would signal more entrenched momentum, as does…
- —The pair completes its 10th straight week in the DBB sell zone, and its 4th straight week of hugging the very bottom of this zone.
Likely Trading Range For The Week Ahead: 1.317 – 1.3425.
Looking at both weekly and daily charts for the EURUSD:
- Upside limited to around 1.3425 area, where it would meet resistance from prior three week highs as well as from its 200 week EMA and the upper edge of its descending channel.
- Near-term downside is a bit harder to call. The week’s close at 1.3242 is too close to the 38.2% Fibonacci level of the August uptrend truly broken, so if the Ukraine situation and US data advantage don’t escalate, the pair has a chance for some kind of bounce on profit taking, especially given the crowded short position on the pair.
- However if this level doesn’t hold below this level there is really no significant intermediate term support showing on the weekly EURUSD chart until we hit the lower edge of the descending channel, all the way down around the 1.317 area.
Concluding Thoughts: Medium Long Term Technical Outlook Strategic Summary
The theme of the current downtrend as evolved from one of “strengthening downward momentum versus strong support” to one of “downward momentum overwhelming final strong support,” as the past week saw the prior 3 week’s support smashed and support at the 38.2% Fibonacci level bent. This had held since mid-late 2013, depending on where you place its first test.
As we cover in our fundamental analysis, the EURUSD’s downtrend is more a reflection of the growing fundamental weakness in the EU, aided by fears of added drag from Ukraine, rather than of any dramatic strengthening of the US economy or of expectations of a Fed rate hike, though both bullish USD drivers got some support last week, as we detail in our fundamental analysis.
The unequivocal message from the weekly charts is that the pair will find itself lower in the months ahead, albeit with possible normal counter trend moves within the longer term downtrend.
Perspective Check: EURUSD Long Term Downtrend Since Mid-2008, Peaked At Start Of Great Financial Crisis
For perspective, remember that the EURUSD has been in a long term downtrend ever since July 2008, and its most recent highs of April 2014 were stopped cold by the already well-established downtrend line from mid-2008, as illustrated below.
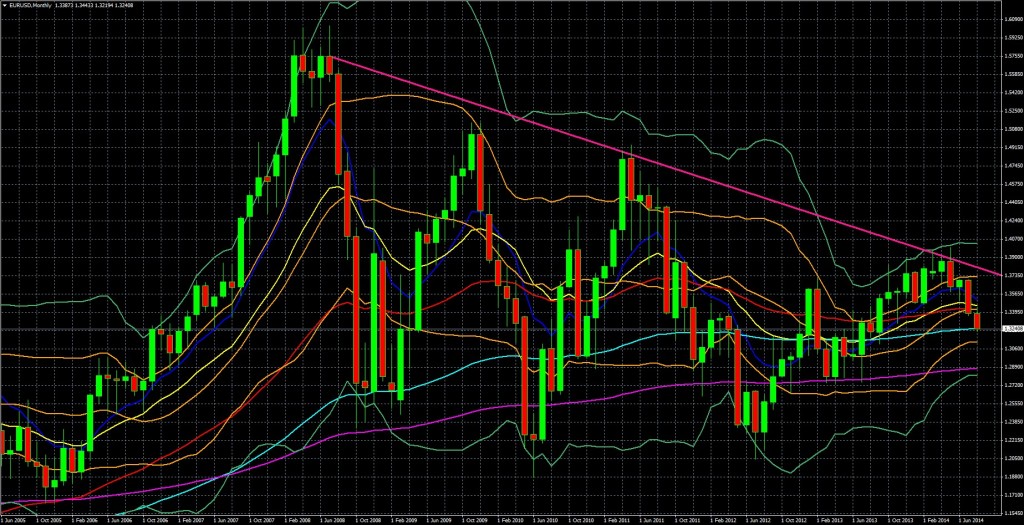
EURUSD Monthly Chart 1 June 2005 to Present
KEY: 10 Month EMA Dark Blue, 20 Month EMA Yellow, 50 Month EMA Red, 100 Month EMA Light Blue, 200 Month EMA Violet, DOUBLE BOLLINGER BANDS: Normal 2 Standard Deviations Green, 1 Standard Deviation Orange. Deep pink downtrend line from EURUSD monthly opening peak of July 2008 to present.
Source: MetaQuotes Software Corp, www.fxempire.com, www.thesensibleguidetoforex.com
Fundamental Outlook: What Drove The EURUSD – Daily Breakdown And Lessons
Daily Breakdown And Lessons
The EURUSD fell solidly for the first three trading days of the week. Why? In essence, a combination of continued better US data or EU weakness, a surprise change of tone in FOMC meeting minutes, and concerns about escalating military and economic sanctions activity, to which the EU is far more exposed.
Monday
There was no obviously market moving top tier news for the US or EU, other than perhaps a miss from EU trade balance and a beat from US NAHB housing market index. Most likely the decline was due to a combination of this data, and both the concerns about military escalations in Ukraine over the weekend as well as the continued effects of recent week’s poor GDP and PMI readings from the EU.
Tuesday
The day’s calendar events again highlighted the “data gap” between the EU and US. Europe’s current account came in under forecasts, as did a batch of UK inflation data. Meanwhile, US building permits and housing starts beat both forecasts and prior month readings. Inflation was low but in line with forecasts. The housing figures also reinforced the effect of Monday’s NAHB housing index, solidifying the message that July was a good month for the critical US housing industry. It’s worth repeating that the US economy is of course more focused on domestic spending and financial services than other economies, and housing related spending is a huge supporter of both of these critical sectors.
The Fed had recently expressed concern about the US housing sector, however Monday and Tuesday’s uniformly upbeat data fed the pro-USD consensus that the Fed will indeed feel ready to end QE in October.
Wednesday: There’s Nothing Like A Change In Central Bank Tone To Move A Currency
Here we had the climactic largest EURUSD drop for the week. It’s important to be aware of the context in which it occurred. Tuesday’s close broke decisively below the 1.335 level, which had been reliable support since the start of August on the daily charts, and also moved the pair firmly back into its multi-month descending channel. That technical breakdown alone surely tempted short term traders to add short positions and ride the once again accelerating short term downtrend.
So with traders already open to adding to an already crowded short positioning, a surprisingly hawkish flavor to the FOMC minutes was both catalyst and fuel for the week’s biggest daily decline. Highlights for the July 29-30 transcript included:
- On employment: “Many Fed officials” thought that the pace of job gains could accelerate the time of the first interest rate hike.
- On Inflation: “most” believed downside pressures on price growth was fading.
While the above gives no specific date for the first 25bp hike, it does present a clearly hawkish tone that supports the consensus belief that it will come between Q4 2014 and mid-to-late 2015.
In a world where markets are now dominated more than ever by speculation about central bank policy, nothing moves a currency like an event that alters expectations about the pace and extent of a policy change, so it’s no huge surprise that the normally predictable FOMC meeting minutes’ hawkish surprise boosted the USD and drove the pair all the way down to its next major support level, even after it had just broken significant through 2-week old support.
Thursday: EURUSD Bounce As Fear of Yellen Dovishness Overrides Good US Data Weak EZ PMIs
As we saw Monday and Tuesday, once again US data’s uniformly positive, forecast beating results stood in contrast to middling-to-weak EU reports. Yet the EURUSD bounced for its only daily gain of the week.
Although at first glance this is baffling, and we didn’t anticipate it, there was a definite logic to the day’s results that is instructive for the future.
The short term traders that dominate EURUSD volume are by nature heavily focused on technical support/resistance levels and positioning. The role of the trader is first and foremost to predict what the herd will do and do it first, regardless of whether that behavior seems particularly rational or not.
The pair had not only plunged hard for 3 straight days, but also Wednesday’s close it had brought the EURUSD all the way down to its next major support indicator, the 38.2% Fibonacci retracement near the 1.335 level. The pair was also oversold on a short term basis by a variety of technical momentum indicators.
So traders were ready to go long (or take profits on shorts) if given any excuse. Janet Yellen’s well-known dovishness and resistance to altering dovish Fed policy based on single-month data points (she makes decisions based on longer term data trends formed over months, not weeks) suggested that ahead of her Friday Jackson Hole speech, some profit taking would be prudent.
After all, the past three days’ declines had already priced in a lot of bullish expectations for the USD. It seemed unlikely that either Yellen, or Draghi, could provide enough of a EURUSD bearish surprise to inspire a selloff strong enough to drive the pair decisively below the 1.335 level on its first try.
- –The Fed is already due to end QE in October, the US recovery is far from robust, inflation is dead, and so there was no reason to suspect Yellen to feed expectations for faster tightening, especially given her well known caution and preference to err on the side of tightening later, just like predecessor Ben Bernanke.
- –Meanwhile, while the EU’s PMIs were uninspiring, Germany and France weren’t as bad as expected, with flash services PMIs for Germany and France actually beating forecasts. The ECB still hasn’t had enough time to evaluate its prior easing measures, and with Germany and France looking a bit better, there was nothing to suspect Draghi will rush in new easing.
A Valuable Reminder Lesson For Understanding Forex Price Movements
In short, the lesson from Thursday is this. As long as forex continues to be dominated by short term traders, daily forex price moves will be dominated by short term (24 hours or less) considerations. As I discuss at length in my book, primary among these are key technical and positioning considerations, as well as a professional (as opposed to the typical retail amateur) short term trader’s focus on short term risk management, which is also based on these technical and positioning factors.
Friday: Rising Ukraine Tensions, Less Dovish Yellen Speech, Drive Selloff
As noted above, the profit taking on Thursday indicated that traders were being cautious and sold the USD (thus boosting the EURUSD) in preparation for a dovish speech. After all, Yellen has consistently shown she’d rather err on the side of caution and tighten too late rather than too early, so there was a good chance she would downplay the recent improvements in U.S. data along with FOMC debates over of an earlier rate rise at the last central bank meeting.
Contrary to those expectations, however, she gave a more balanced approach that was thus, relatively, more hawkish than expected because she didn’t rule out the chance of a more hawkish tone at next month’s Fed meeting. Yellen confirmed that asset purchases will end in October and indicated that if jobs data improved faster, that could bring an earlier rate hike. This key line would have boosted the USD and sent the EURUSD down further if she hadn’t immediately added that slower jobs data improvements could delay a rate increase.
ECB President Draghi’s speech offered nothing new and thus did nothing to counteract the bullish USD reaction that sent the EURUSD lower.
Note that continued escalation of Ukraine tensions also contributed to the Friday selloff, and had the pair down hard early in the day before it attempted to bounce ahead of those speeches. The result was a technically damaging, very bearish close at 1.32420, below the key support of the 38.2% Fibonacci retracement level of the May 2012 EURUSD rally around 1.3250.
Conclusions, Lessons: Top Fundamental Drivers Of The Week’s Big EURUSD Selloff?
It’s too early to call this penetration an actual breakdown of this support level. However we can say the 1.3330 level, which had held consistently after 3 weeks of tests, is now decisively broken.
Ultimately, the week’s big EURUSD fundamental drivers were:
- –Rising risks of economic damage from escalating Ukraine tensions from Russia’s “humanitarian” convoy into Ukrainian territory without the consent of Ukrainian authorities, which they correctly labeled as a “direct invasion.”
- –Strengthening of the ‘data gap’ between improving US economic data and deteriorating EU figures, which feed conviction about an ultimate, enduring USD interest rate advantage with the coming year.
- Rising expectations about the pace and timing of a Fed rate hike, fueled by:
- –A more hawkish FOMC meeting minutes that solidified expectations that the first 25 bps hike comes within the next 12 months
- –A modestly less dovish Yellen speech that didn’t counter that impression.
All of the above helped buttress expectations for both near term USD gains versus the EUR and for a sustained USD rate advantage within the coming year.
Other Key Lessons: Longer Term Drivers
Here we focus on longer term concerns.
Europe’s economy is struggling even before the current round of economic sanctions take effect. Given the recent Russian invasion by a purportedly humanitarian Russian aid convoy, a new round of economic sanctions against Russia, and Russian counter-sanctions is coming. Russian trade is a bigger portion of Europe’s GDP and so these hurt the EUR more than the USD.
Italian sovereign debt is unsustainable and presents the biggest risk of starting the next EU debt crisis. Edward Hugh had a great piece out last week on the likely catalyst for the next phase of the EU debt and banking crisis. He details how Italy’s debt levels are both unsustainable and unlikely to shrink in the years ahead. Unlike the debt of Greece or Portugal, Italy’s sovereign debt is too large to be resolved with more extend and pretend programs of lending more printed money. Although markets continue to believe ECB President Draghi can and will ultimately prevent a new crisis, it’s just a matter of time before bond markets realize that he can’t. Stay tuned for more on this in our coming post on the next phase of the EU crisis and how to spot its coming. Note, although Hugh focuses on Italy, we could easily see the same thing from Spain.
The EU’s biggest mistake and what has actually preserved it thus far. Ok, I mean “biggest mistake” after allowing so many member states to take on too much debt. Joe Weisenthal argues here that austerity was a huge mistake, the EU’s lack of a central bank that can print as much money as needed is the key weakness of the EU which prevents its long term stabilization. Draghi’s promise in 2012 to do whatever it takes was a bluff that attempted to suggest that power, but he doesn’t have it.
Coming Week Likely Top Market Movers To Watch
- Continued Ukraine escalation. See our coming post on top lesson and market movers for the coming week.
- Top economic calendar events highlighted below. As mentioned in earlier posts, EU data is more important at this stage because the ECB’s policy is still in flux, with more easing a matter of when, not if.
- Technical support levels. While last week’s close was not far enough below the 38.2% Fibonacci retracement of the May 2012 rally around 1.3250 to call this support broken just yet, further declines should tempt traders to test the next big support indicator, the lower edge of the pair’s descending channel around 1.3176 shown in the above weekly EURUSD chart, especially if the above mentioned fundamental drivers of last week (Ukraine tensions, US-Europe data gap) persist.
Top Calendar Events To Watch
Top tier events with the most market moving potential are shown in boldface
Monday
EU: German Ifo business climate
US: flash services PMI, new home sales
Tuesday
US: Durable goods m/m, S&P/Case Shiller composite 20 HPI y/y, CB consumer confidence
Wednesday: No likely market moving reports scheduled
Thursday
EU: German, Spain preliminary CPI m/m, Italy 10 year bond auction
US: Preliminary GDP q/q, weekly new jobless claims, pending home sales m/m
Friday
EU: German retail sales, EU PI flash estimate y/y
US: Core PCE price index m/m, personal spending, income, m/m, Chicago PMI, revised UoM consumer sentiment
Biggest Questions & What To Watch To Answer Them
Will Russia continue escalating its Ukraine invasion?
Will data continue to show the US economy pulling away from the EU? If so, is that improvement enough to justify rising expectations about the scope and pace of Fed tightening?
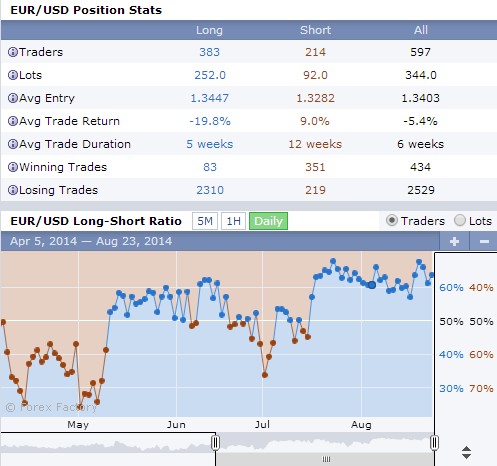
Sample Retail Traders Positioning
Once again, our real time sample of retail traders continue to attempt to fade the current EURUSD trend rather than ride it. They remain a group worth watching, because doing the opposite has proven profitable since the start of July.
The above is for informational purposes only, responsibility for all trading or investing decisions lies solely with the reader.


