
Facing Overhead Resistance – Weekly Market Outlook
Had it not been for Friday's dip, the market would have actually logged its third weekly gain in a row last week. Problem is, Friday happened. Indeed, Friday's action may have underscored a much bigger problem for the bulls – a problem that could have been easily discarded with just a little progress. Now that the problem's been exposed though, it may become a huge psychological hurdle.
We'll take a closer look at that potential pitfall in a moment. First, let's dissect last week's key economic numbers.
Economic Calendar
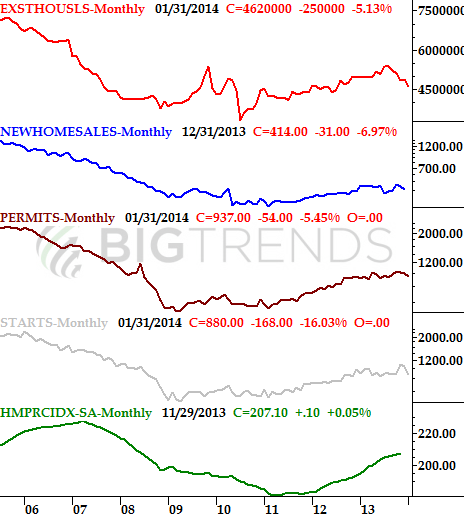
Last week's economic data was overloaded with real estate and construction numbers. And, though it wouldn't be accurate to categorize those overall results as "bad", they certainly weren't good…. the recent weakness on the housing front continued to develop. It's pretty clear now that housing and homebuilding aren't easy money, even if part of the snag last month wad weather-related.
Specifically, building permits fell from a pace of 991,000 to 937,000 in January, and December's housing starts of 1.048 million fell to a pace of 937,000 last month. As for existing home sales, they fell from 4.87 million in December to 4.62 million in January.
We don't yet have December's home price data yet, but as you'll see on the calendar below, the information is due on Tuesday (January's housing price information won't be available until late March). Still, assuming the modest slump in January's activity isn't a fluke, there's likely to be some pressure on the price front too.
Real Estate & Construction Trends Chart
The only other big data we got last week was inflation numbers from last month. Producer prices as well as consumer prices were up a tad in January, but just a tad. As of right now, the annualized consumer inflation rate is 1.58%, and the producer price inflation rate stands at 1.2%. While it's good that prices aren't soaring for anyone, it's a little alarming that sellers don't have at least a little more pricing power. Still, prices are relatively stable, and sustainable at current levels.
Everything else is on the following grid.
Economic Calendar
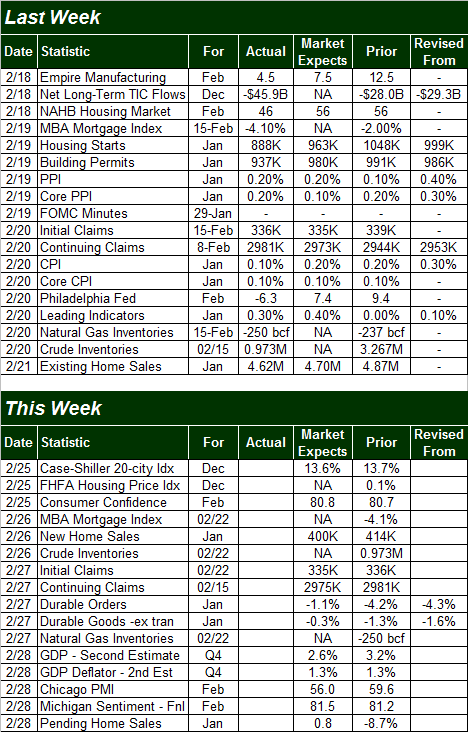
Aside from the aforementioned home price data coming out on Tuesday, there's not a whole lot of meaningful information in the queue this week. Tuesday's consider confidence score could be a biggie though. The last few weeks haven't been easy ones, and there's a good chance the figure could fall back from January's surge. Still, the bigger trend here remains positive.
On Thursday we'll get another round of durable orders data. The pros are looking for a 1.1% dip overall, and following December's 4.2% decline, that could be a major red flag. Even taking transportation orders out of the equation, last month's pullback doesn't leave any room for another bad month.
Stock Market Index Analysis
So what's this big "problem" that developed last week? In simplest terms, there can be no doubt that the S&P 500 (SPX) (SPY) has a huge – and strong – ceiling right around 1848. Now that investors know it's there, they know to fear it…. and if they fear it, there's a good chance they may not even try to hurdle it.
The chart of the S&P 500 explains everything. When the market peaked around 1848 (dashed) in late December, it was chalked up to the fact that stocks were overbought. When 1848 was tested but not cleared in late January, it was chalked up to coincidence. When the S&P 500 had two great shots at moving above 1848 last week, however, and didn't, it became pretty clear the S&P 500 is dealing with a serious resistance line.
S&P 500 & VIX – Daily Chart
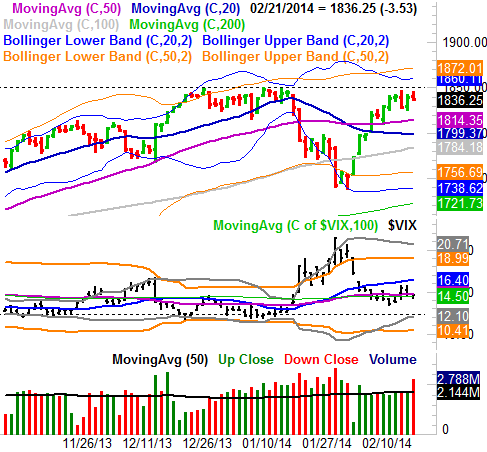
Whether it's a technical problem or merely a psychological one is irrelevant at this point – it's become a technical one, and until the index proves it has the right stuff to move above 1848, betting on more bullishness from here is perceived as a bet too risky to make.
The good news is, it's not like the S&P 500 is past the point of no return. As long as the index can hold above the 20-day moving average line (blue) at 1799 and the 50-day moving average line (purple) at 1814, the bulls will remain within striking distance of breaking above 1848.
Nothing really changes when you zoom out to the weekly chart of the S&P 500. In fact, the resistance a round 1848 actually looks clearer in the longer-term timeframe. But, so does the longer-term uptrend. Barring a complete meltdown and close under the 100-day moving average line (gray), the trend ultimately remains bullish. In fact, it's more likely than not that the S&P 500 is going to aim for its upper 26-week and upper 52-week Bollinger bands around 1883 before it's all said and done. Again, it just has a big problem it needs to take care of at 1848.
S&P 500 & VIX - Weekly Chart
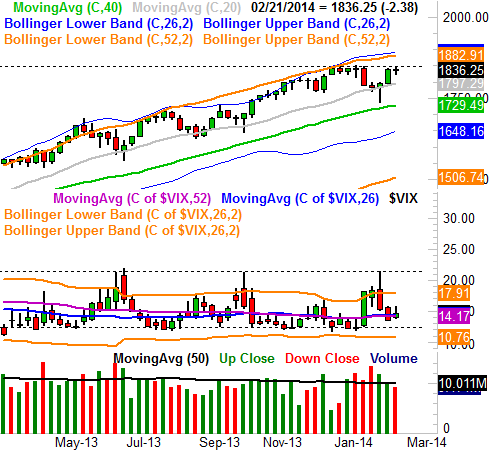
You can also see on the weekly chart that the CBOE Volatility Index (VIX) (VXX) still has room to keep moving lower before hitting its floor around 12.40, which is a good part of the reason the market's more likely near-term outcome is still a bullish one. Once again though, it will all start with a move above 1848. Anything less, and stocks are just stuck in neutral.
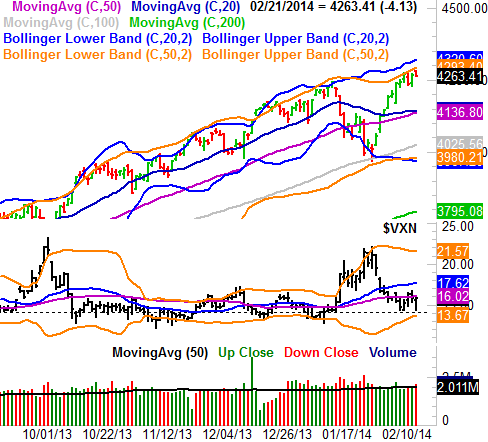
With all of that being said, a quick look at the chart of the NASDAQ Composite (COMP) (QQQ) takes some air out of any optimism. How so? The NASDAQ already bumped into its upper 50-day Bollinger band last week, and as usual, found resistance there…. perhaps found too much resistance, too easily. And, not quite like the VIX, the VXN (the NASDAQ's volatility index) formed a reversal-esque bar on Friday at a recently-established floor around 14.2. Maybe it was just the result of an option expiration day, or maybe it's a hint that the rally is out of gas after all.
NASDAQ Composite & VXN - Daily Chart
As was the case with the S&P 500, there's nothing "for sure" right now with the NASDSQ Composite. What happens this week is going to make or break it. Stay tuned.
Trade Well,
Price Headley
None.


