
Initial Claims, Retail Sales And Job Openings - All Bad News
First time unemployment claims had their worst performance last week since 2009. Actual, not seasonally adjusted claims were up 7.5% versus the same week last year. That’s outside the normal range. Is it a calendar anomaly. Even though the seasonally adjusted headline number was worse than the consensus expectation, the pundits were sanguine. I’m not so sure they should be, but we won’t know for a few weeks. If this sticks, it’s a clear break of the nearly 5 year trend of improvement, a sudden sign of economic weakness.
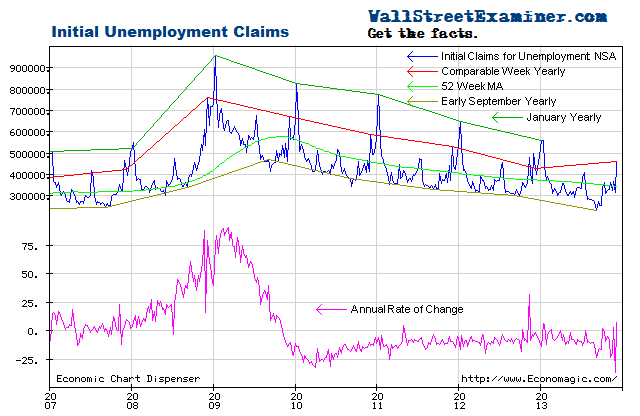
Initial Unemployment Claims – Click to enlarge
Withholding tax collections, which are reported in real time, and which I cover in the weekly Professional Edition Treasury updates, were below trend that week, and the trend has been weakening. The economy may be slowing just when virtually everyone expects the Fed to taper.
If this weaker data sticks, it’s an ugly omen versus bubbly stock prices.
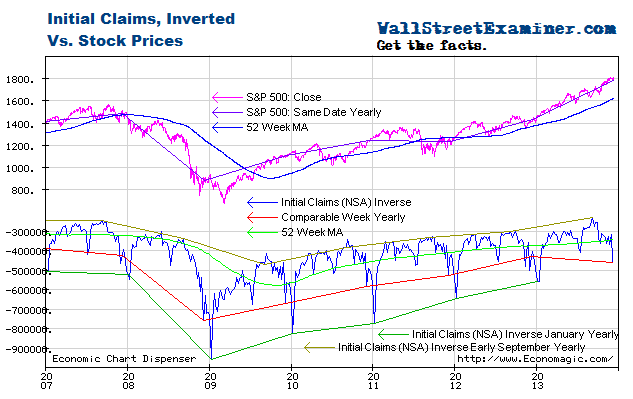
Initial Unemployment Claims and Stock Prices- Click to enlarge
Real retail sales excluding gasoline sales, actual not seasonally adjusted, rose 3.5% year to year. That’s right on trend. The headline seasonally adjusted number slightly beat consensus expectations.
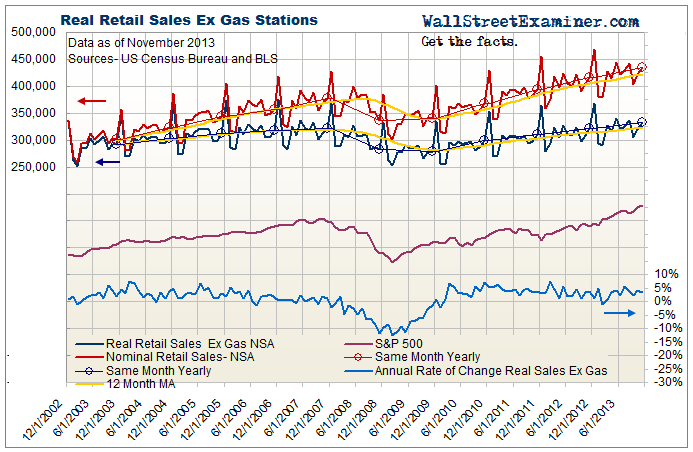
Retail Sales and Real Retail Sales Ex Gasoline – Click to enlarge
While the nominal retail sales have been surging to new highs since 2010, actual unit volume, excluding gasoline, just began to exceed 2007 levels in recent months. This is in spite of the fact that US population is 6% higher now than in 2007. Real sales per capita remain at 1998 levels, well below the peak level of 2003-2007. It’s no secret that while the top 7% are doing well, the vast majority of Americans are worse off and are spending less than they were a dozen years ago.
I’ll post a chart of this data for November next week after official CPI data is posted. Stay tuned for that.
Also out this week was the Job Openings and Labor Turnover Survey (JOLTS) for October, reported to be a favorite of Janet Yellen. Job openings for that month were up 7.9% versus October 2012, virtually unchanged from the September gain, and slightly better than the growth rate earlier in the year. But its much slower growth than in 2012. The growth rate of job openings actually slowed when the Fed started QE 3 and 4 in November of last year. So much for QE helping the economy. But it helped stock prices go into bubble mode.
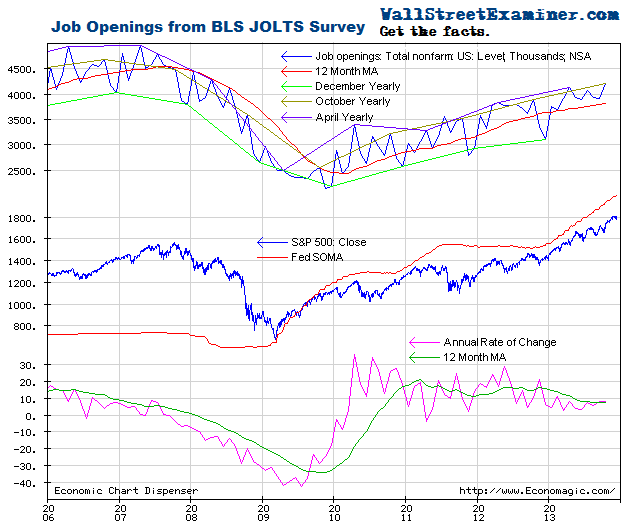
Job Openings Versus QE and Stock Prices- Click to enlarge
Get regular updates on the machinations of the Fed, Treasury, Primary Dealers and foreign central banks in the US market, in the Fed Report in the Professional Edition, Money Liquidity, and Real Estate Package. Click this link to try WSE's Professional Edition risk free for 30 days!
Copyright © 2012 The Wall Street Examiner. All Rights Reserved. The above may be reposted with attribution and a prominent link to the Wall Street Examiner.
Get regular updates on the machinations of the Fed, Treasury, Primary Dealers and foreign central banks in the Fed Report in the Professional Edition, Money Liquidity, and Real Estate Package. ...
more

