
Is A Big Move In Stocks Coming Soon?
It Can’t Hurt To Be Prepared
Regular readers know we make decisions based on hard evidence from the markets, rather than attempting to forecast what will happen next. Therefore, we will be prepared for bullish, bearish, and sideways outcomes with a Fed meeting on tap this week. The market is telling us to be prepared for a big move (up or down) based on the current look of the charts.
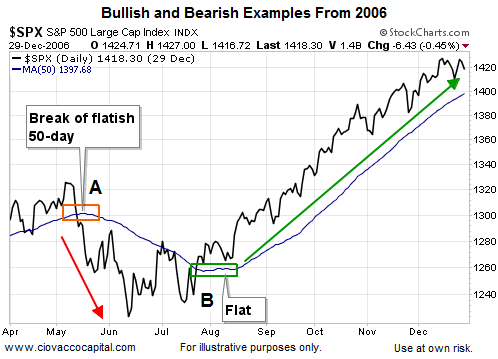
Big Moves Can Follow This Look
The 50-day moving average helps filter out day-to-day volatility in the markets, allowing us to focus on the intermediate-term trend. When the slope of the 50-day starts to flatten out, it tells us the battle between the bulls and bears is relatively even from an intermediate-term perspective. An even battle speaks to indecisiveness about all the fundamental drivers, including:
- Fed policy
- Earnings
- Valuations
- Geopolitical risks
Once the market makes up its mind, big moves in stock prices often follow. The chart of the S&P 500 from 2006 below shows two examples.
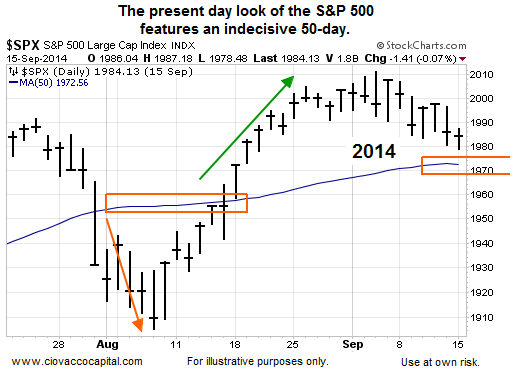
How Do The Markets Look Today?
Since a picture is worth a thousand words, we will let the markets do the talking below. The 50-day moving averages are shown in blue.
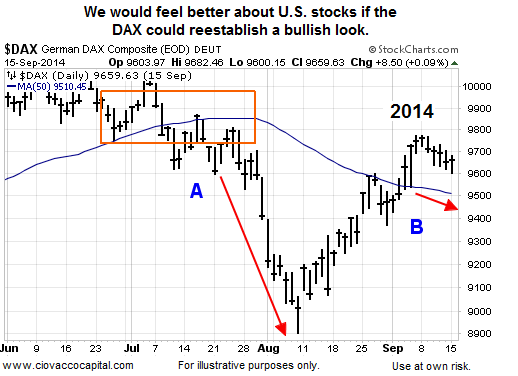
German Stocks Have Work To Do
The German DAX (EWG) is highly correlated to the S&P 500, meaning they tend to zig and zag in unison for the most part. In the chart below, notice how the DAX dropped significantly from “a flat 50-day” look near point A. The present day slope remains concerning near point B. The bulls prefer to see the DAX’s 50-day turn back up.
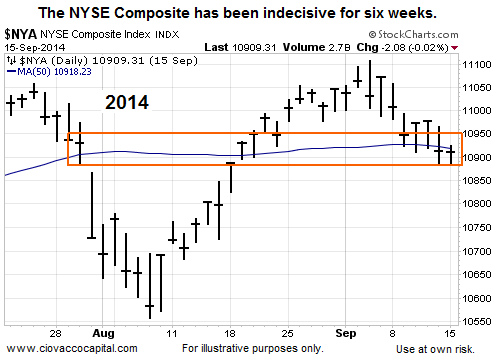
Broader Market Looks Tired
The longer the NYSE Composite Index stays below the 50-day, and the longer the slope of the 50-day is negative, the more concerning it becomes for equities in general. Our concerns would begin to subside if price can push back above the 50-day and the slope can turn back up.
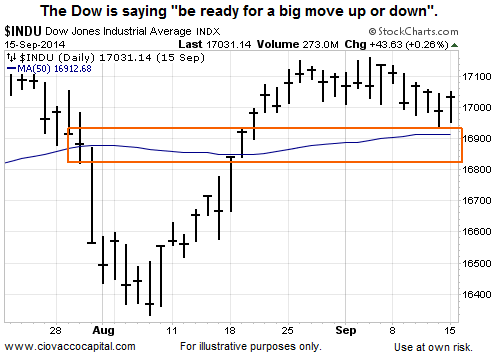
Dow Is Also Saying Pay Closer Attention
The 50-day can’t get much flatter or indecisive on the Dow (DIA), which is not surprising given the uncertainty with the Fed, interest rates, inflation, and the economy.
Investment Implications – The Weight Of The Evidence
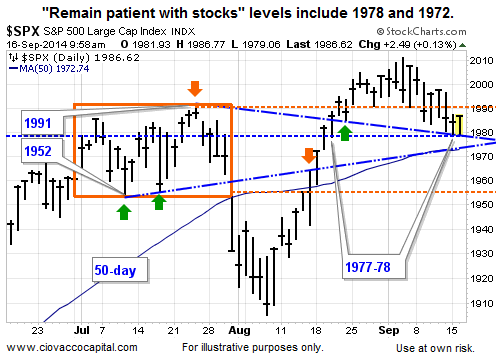
The moral of the story? It is prudent to have a “stocks surprise on the upside” game plan in place, along with “stocks sell-off hard” contingency plans. In terms of execution, monitoring market levels is one method. For example, in the S&P 500’s chart below we will try to exercise some patience with our stock positions (VOO) as long as the S&P 500 remains above its 50-day moving average (near 1972). Even during the weakest part of Tuesday’s session, the S&P 500 was still trading at a “remain calm” 1979.
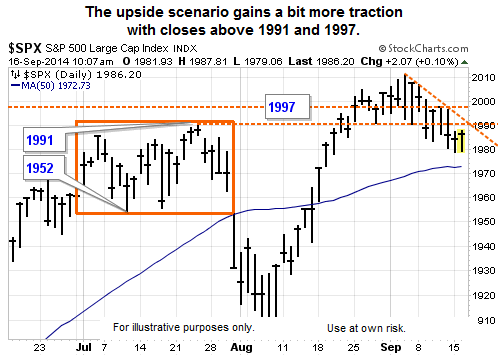
From a bullish perspective, if the S&P 500 (SPY) can close above 1991 and then 1997, we would be more open to adding to our stock holdings.
We will monitor the situation with an open mind and make changes if needed based on the hard and observable evidence, which is in stark contrast to a “forecast and hope” strategy.
Disclosure: None.


