
Is The US Stock Market Rally Built On Solid Ground?
The S&P 500 briefly traded above 2000 yesterday for the first time. The all-time high inspired some analysts to announce (not necessarily for the first time) that the stock market was in bubble territory. But there’s a reason for the bull market: economic growth. We can debate if the growth is sustainable or even genuine–some say it’s an artifact of central bank liquidity. But that’s a separate issue. Growth is still growth, and the market’s reacting to current conditions accordingly.
Consider yesterday’s monthly update of the Chicago Fed National Activity Index: the three-month average of this broad measure of US economic activity increased to 0.25 for the July reading. That’s in the upper range of values in recent years and a sign that growth is rolling along at a moderately above-trend pace. Only values below -0.70 indicate an “increasing likelihood” that a recession has started, according to guidelines from the Chicago Fed. By that standard, recession risk is quite low, based on the latest available set of indicators.

The news that the economy is humming along is hardly news at this point. My econometric modeling has been advising no less for some time now. In addition, it appears that the housing market’s stumble in the winter and spring is giving way to stronger growth, as recent updates suggest. Housing starts in July, for instance, rebounded sharply and existing home sales followed suit last month. Yesterday’s report on new home sales was a bit soft in terms of the monthly comparison, although the year-over-year trend looks more encouraging. Sales of newly built single-family homes increased 12.3% for the year through July—the highest annual rate so far this year.
As for equities, it’s no surprise to see stocks trending higher. As usual, the market has been discounting the future and it likes what it sees. That doesn’t mean that stocks are immune to corrections. Irrational exuberance can and does spoil the party at times. But with a generally positive macro backdrop, short-term market volatility alone isn’t going to change the big picture on the economy.
Turning to the topic of bubbles, we can run a pair of econometric tests for some perspective and bring a degree of objectivity to this slippery concept. As a preview, bubble risk for the S&P 500, while elevated vs. recent history, still doesn’t look extreme.
Exhibit A is a test that looks for periods of extreme non-stationary price behavior (for a summary on the methodology, see this post). Based on running the numbers through last night’s close (Aug. 25), it’s clear that the S&P’s bubble risk is elevated relative to just a few months earlier. That said, we’re still well below the levels that have historically been associated with extreme conditions (values at or above 0.95 in the chart below).

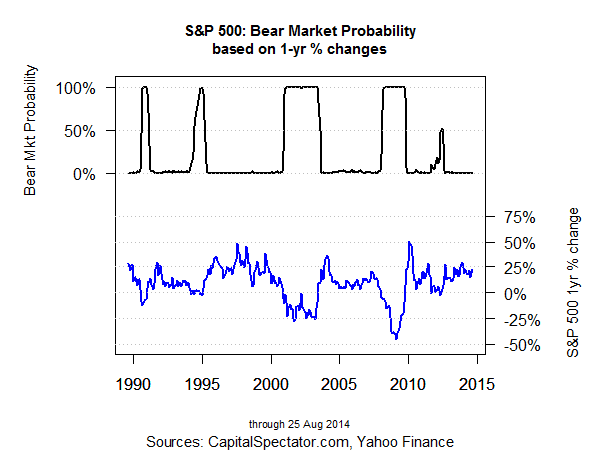
Next, let’s analyze the S&P data through the prism of another econometric test that searches for so-called regime shifts via a Hidden Markov model (for some background, see this post). Here, too, the results don’t look threatening. In the chart below, the model estimates the probability that the S&P 500 is in a bear market. Not surprisingly, the estimated probability is nil at the moment.
The next chart also runs the data through a Hidden Markov model, but this time the output is a binary signal rather than a more granular approach via probabilities. But the outcome is the same: the model tells us that the S&P 500 remains in a bull-market regime state.

All the usual caveats apply, of course, including the ever-present risk that an exogenous risk factor could create havoc. Some risks just can’t be modeled, and so one can never discount the potential that an unknown unknown is lurking around the corner.
That said, data from the macro and financial realms imply that the bullish aura for the US economy and financial markets has a strong foundation at the moment. Indeed, encouraging macro data is the fuel that’s driving stocks higher. But this happy state of affairs doesn’t mean there’s no risk in the financial markets. Indeed, if economic momentum is bullish, why is the benchmark 10-year Treasury yield trending down? Macro conditions in the US certainly don’t warrant a lesser yield at this point. In search of catalysts for falling rates, one needs to look beyond the US. Meantime, if you’re looking for risky behavior to worry about, consider the downward slope on the 10-year yield in recent history.

Disclosure: None.


