
January 2014 Producer Prices Index Has Been Reworked
The Producer Price Index has been reworked, and if you view it from last months report there is little change. This index is volatile (noisy).

The PPI represents inflation pressure (or lack thereof) that migrates into consumer price.
- The BLS reported that the Producer Price Index (PPI) finished goods prices year-over-year inflation rate rose from 1.1% (originally 1.2%) to 1.2%.
- The market had been expecting finished goods price inflation of -0.2% to 0.4% (consensus 0.2%) month-over-month versus the 0.2% reported.
- It was food which drove the month-over-month inflation, while transport was a large deflationary pressure.
- Note that there are several changes associated with this release:
- Seasonal adjustment factors have been recalculated.
- Effective with this release, the Producer Price Index (PPI) includes data for 34 resampled industries classified according to the 2012 North American Industry Classification System (NAICS). The Bureau of Labor Statistics periodically updates the sample of producers providing data for the PPI to reflect current conditions more accurately when the structure, membership, technology, or product mix of an industry shifts. The first results of this systematic process were published in July 1986. Subsequent efforts have been completed at 6-month intervals.
- With this release, BLS transitions from the Stage of Processing (SOP) to the Final Demand-Intermediate Demand (FD-ID) aggregation system. This shift results in significant changes to the PPI news release, as well as other documents available from PPI. The transition to the FD-ID system is the culmination of a longstanding PPI objective to improve the current SOP aggregation system by incorporating PPIs for services, construction, government purchases, and exports. In comparison to the SOP system, the FD-ID system more than doubles current PPI coverage of the United States economy to over 75 percent of in-scope domestic production. The FD-ID system was introduced as a set of experimental indexes in January 2011. Nearly all new FD-ID goods, services, and construction indexes provide historical data back to either November 2009 or April 2010, while the indexes for goods that correspond with the historical SOP indexes go back to the 1970s or earlier.
The manufacturing supply chain inflation:
- finished goods annual inflation = from 1.1% to 1.2%
- intermediate goods annual inflation = from 0.0% to 0.3%
- crude goods annual inflation = from -2.1% to -0.9%
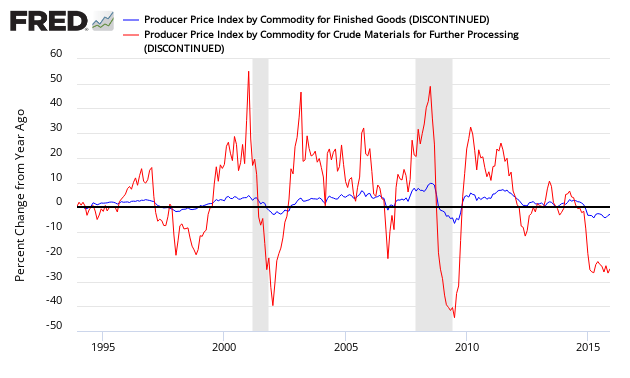
In the following graph, one can see the relationship between the year-over-year change in crude good index and the finish goods index. When the crude goods growth falls under finish goods – it usually drags finished goods lower.
Percent Change Year-over-Year – Comparing PPI Finished Goods (blue line) to PPI Crude Materials (red line)
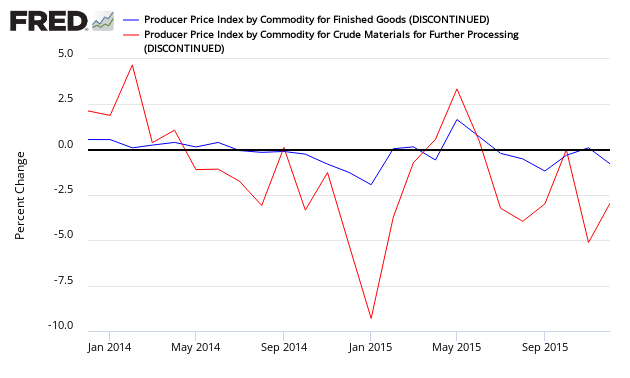
Percent Change Month-over-Month- Comparing PPI Finished Goods (blue line) to PPI Crude Materials (red line)
The core PPI (excluding food and energy) was up 0.4% month-over-month (the market expect core to grow 0.0% to 0.3% – consensus 0.2%). Removing food and energy was originally done to remove the noise from the index, however the usefulness in the twenty-first century is questionable except in certain specific circumstance.
PPI Core Inflation (finished goods less food & energy) – Year-over-Year (blue line, left axis) and Month-over-Month (red line, right axis)

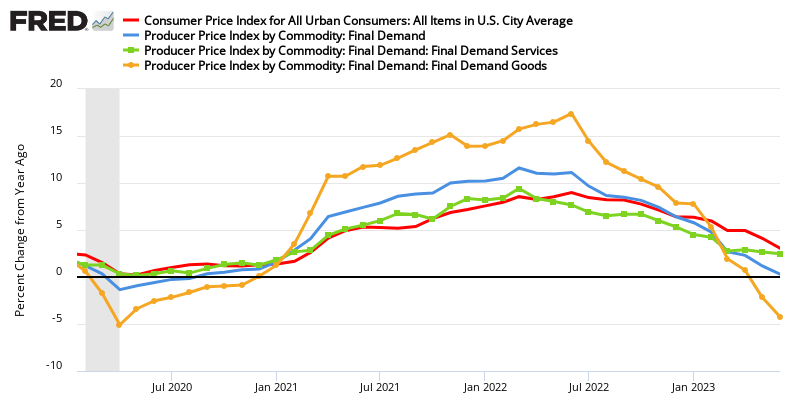
Econintersect has shown how pricing change moves from the PPI to the Consumer Price Index (CPI). This YoY change implies that the CPI, should come in around 2.0% YoY.
Comparing Year-over-Year Change Between the PPI Finished Goods Index (blue line) and the CPI-U (red line)
The price moderation of the PPI began in September 2011 when the year-over-year inflation was 7.0%
Caveats on the Use of Producer Price Index
Econintersect has performed several tests on this series and finds it fairly representative of price changes (inflation). However, the headline rate is an average – and for an individual good or commodity, this series provides many sub-indices for specific application.
A very good primer on the Producer Price Index nuances can be found here.
Because of the nuances in determining the month-over-month index values, the year-over-year or annual change in the PPI index is preferred for comparisons.
There is moderate correlation between crude goods and finished goods as shown on the first graph in this post. Higher crude material prices push the finished goods prices up.
None.


